Slavic vs Apache In Labor Force | Age 16-19
COMPARE
Slavic
Apache
In Labor Force | Age 16-19
In Labor Force | Age 16-19 Comparison
Slavs
Apache
40.4%
IN LABOR FORCE | AGE 16-19
100.0/ 100
METRIC RATING
59th/ 347
METRIC RANK
35.6%
IN LABOR FORCE | AGE 16-19
11.0/ 100
METRIC RATING
214th/ 347
METRIC RANK
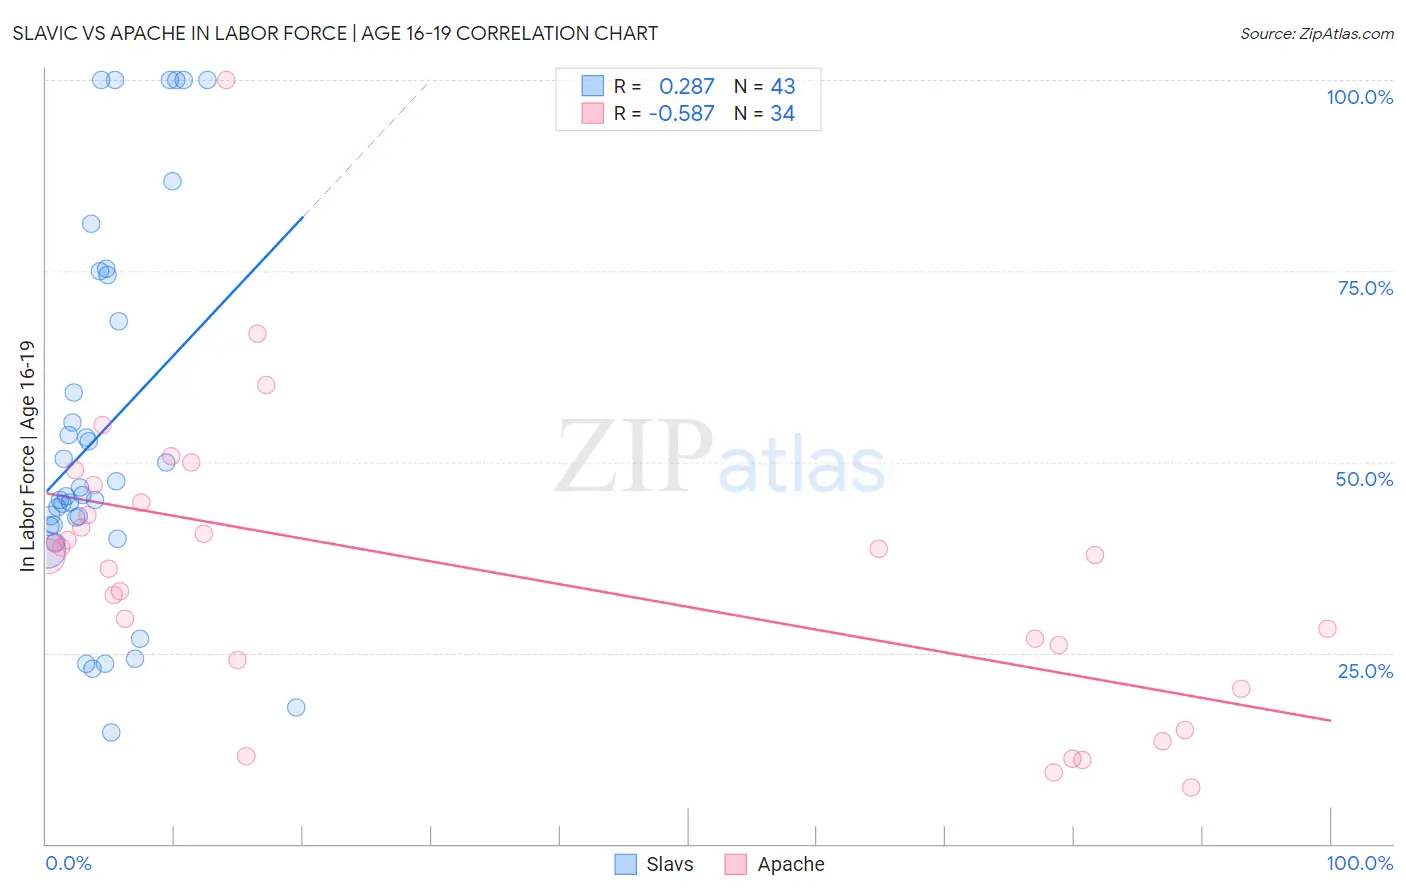
Slavic vs Apache In Labor Force | Age 16-19 Correlation Chart
The statistical analysis conducted on geographies consisting of 270,628,141 people shows a weak positive correlation between the proportion of Slavs and labor force participation rate among population between the ages 16 and 19 in the United States with a correlation coefficient (R) of 0.287 and weighted average of 40.4%. Similarly, the statistical analysis conducted on geographies consisting of 230,841,914 people shows a substantial negative correlation between the proportion of Apache and labor force participation rate among population between the ages 16 and 19 in the United States with a correlation coefficient (R) of -0.587 and weighted average of 35.6%, a difference of 13.4%.
In Labor Force | Age 16-19 Correlation Summary
| Measurement | Slavic | Apache |
| Minimum | 14.6% | 7.4% |
| Maximum | 100.0% | 100.0% |
| Range | 85.4% | 92.6% |
| Mean | 54.1% | 35.7% |
| Median | 45.6% | 37.7% |
| Interquartile 25% (IQ1) | 41.6% | 24.0% |
| Interquartile 75% (IQ3) | 74.5% | 44.6% |
| Interquartile Range (IQR) | 32.9% | 20.6% |
| Standard Deviation (Sample) | 24.6% | 19.0% |
| Standard Deviation (Population) | 24.3% | 18.7% |
Similar Demographics by In Labor Force | Age 16-19
Demographics Similar to Slavs by In Labor Force | Age 16-19
In terms of in labor force | age 16-19, the demographic groups most similar to Slavs are Immigrants from Eastern Africa (40.4%, a difference of 0.040%), Aleut (40.4%, a difference of 0.13%), Lithuanian (40.4%, a difference of 0.15%), Fijian (40.4%, a difference of 0.17%), and American (40.3%, a difference of 0.19%).
| Demographics | Rating | Rank | In Labor Force | Age 16-19 |
| Immigrants | Laos | 100.0 /100 | #52 | Exceptional 40.6% |
| Immigrants | Kenya | 100.0 /100 | #53 | Exceptional 40.5% |
| Tlingit-Haida | 100.0 /100 | #54 | Exceptional 40.5% |
| British | 100.0 /100 | #55 | Exceptional 40.5% |
| Fijians | 100.0 /100 | #56 | Exceptional 40.4% |
| Lithuanians | 100.0 /100 | #57 | Exceptional 40.4% |
| Aleuts | 100.0 /100 | #58 | Exceptional 40.4% |
| Slavs | 100.0 /100 | #59 | Exceptional 40.4% |
| Immigrants | Eastern Africa | 100.0 /100 | #60 | Exceptional 40.4% |
| Americans | 100.0 /100 | #61 | Exceptional 40.3% |
| Cherokee | 100.0 /100 | #62 | Exceptional 40.2% |
| Northern Europeans | 100.0 /100 | #63 | Exceptional 40.2% |
| Immigrants | Micronesia | 100.0 /100 | #64 | Exceptional 40.2% |
| Kenyans | 100.0 /100 | #65 | Exceptional 40.1% |
| Immigrants | Nonimmigrants | 100.0 /100 | #66 | Exceptional 40.1% |
Demographics Similar to Apache by In Labor Force | Age 16-19
In terms of in labor force | age 16-19, the demographic groups most similar to Apache are Houma (35.6%, a difference of 0.010%), Immigrants from Bolivia (35.6%, a difference of 0.010%), Immigrants from South Eastern Asia (35.6%, a difference of 0.020%), Dutch West Indian (35.6%, a difference of 0.040%), and Immigrants from Costa Rica (35.6%, a difference of 0.040%).
| Demographics | Rating | Rank | In Labor Force | Age 16-19 |
| Immigrants | Eastern Europe | 14.5 /100 | #207 | Poor 35.8% |
| Koreans | 13.3 /100 | #208 | Poor 35.7% |
| Moroccans | 12.7 /100 | #209 | Poor 35.7% |
| Immigrants | Switzerland | 11.9 /100 | #210 | Poor 35.6% |
| Mexicans | 11.9 /100 | #211 | Poor 35.6% |
| Houma | 11.0 /100 | #212 | Poor 35.6% |
| Immigrants | Bolivia | 11.0 /100 | #213 | Poor 35.6% |
| Apache | 11.0 /100 | #214 | Poor 35.6% |
| Immigrants | South Eastern Asia | 10.8 /100 | #215 | Poor 35.6% |
| Dutch West Indians | 10.7 /100 | #216 | Poor 35.6% |
| Immigrants | Costa Rica | 10.7 /100 | #217 | Poor 35.6% |
| Sri Lankans | 9.8 /100 | #218 | Tragic 35.5% |
| Guatemalans | 8.6 /100 | #219 | Tragic 35.5% |
| Immigrants | Bahamas | 8.3 /100 | #220 | Tragic 35.5% |
| Turks | 7.3 /100 | #221 | Tragic 35.4% |