Shoshone vs Immigrants from Hong Kong In Labor Force | Age 25-29
COMPARE
Shoshone
Immigrants from Hong Kong
In Labor Force | Age 25-29
In Labor Force | Age 25-29 Comparison
Shoshone
Immigrants from Hong Kong
81.6%
IN LABOR FORCE | AGE 25-29
0.0/ 100
METRIC RATING
321st/ 347
METRIC RANK
85.0%
IN LABOR FORCE | AGE 25-29
92.8/ 100
METRIC RATING
105th/ 347
METRIC RANK
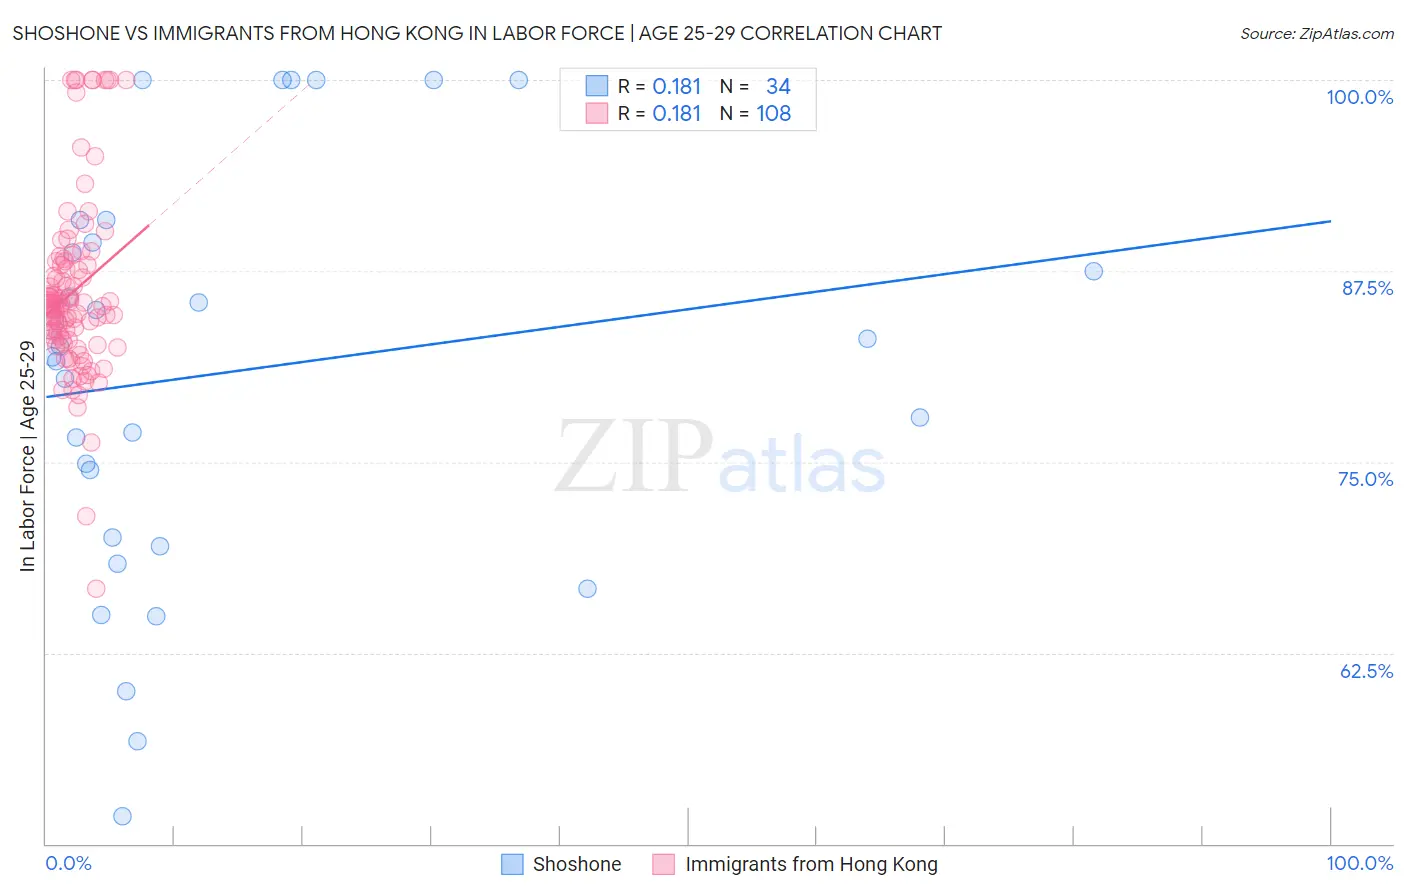
Shoshone vs Immigrants from Hong Kong In Labor Force | Age 25-29 Correlation Chart
The statistical analysis conducted on geographies consisting of 66,617,603 people shows a poor positive correlation between the proportion of Shoshone and labor force participation rate among population between the ages 25 and 29 in the United States with a correlation coefficient (R) of 0.181 and weighted average of 81.6%. Similarly, the statistical analysis conducted on geographies consisting of 253,942,072 people shows a poor positive correlation between the proportion of Immigrants from Hong Kong and labor force participation rate among population between the ages 25 and 29 in the United States with a correlation coefficient (R) of 0.181 and weighted average of 85.0%, a difference of 4.2%.
In Labor Force | Age 25-29 Correlation Summary
| Measurement | Shoshone | Immigrants from Hong Kong |
| Minimum | 51.8% | 66.7% |
| Maximum | 100.0% | 100.0% |
| Range | 48.2% | 33.3% |
| Mean | 80.9% | 86.1% |
| Median | 82.2% | 85.3% |
| Interquartile 25% (IQ1) | 70.1% | 83.0% |
| Interquartile 75% (IQ3) | 89.4% | 88.0% |
| Interquartile Range (IQR) | 19.3% | 5.0% |
| Standard Deviation (Sample) | 13.2% | 5.9% |
| Standard Deviation (Population) | 13.0% | 5.9% |
Similar Demographics by In Labor Force | Age 25-29
Demographics Similar to Shoshone by In Labor Force | Age 25-29
In terms of in labor force | age 25-29, the demographic groups most similar to Shoshone are Kiowa (81.6%, a difference of 0.010%), Colville (81.6%, a difference of 0.060%), Alaska Native (81.6%, a difference of 0.060%), Seminole (81.7%, a difference of 0.11%), and Comanche (81.9%, a difference of 0.32%).
| Demographics | Rating | Rank | In Labor Force | Age 25-29 |
| Cherokee | 0.0 /100 | #314 | Tragic 82.1% |
| Immigrants | Mexico | 0.0 /100 | #315 | Tragic 82.0% |
| Mexicans | 0.0 /100 | #316 | Tragic 81.9% |
| Chickasaw | 0.0 /100 | #317 | Tragic 81.9% |
| Comanche | 0.0 /100 | #318 | Tragic 81.9% |
| Seminole | 0.0 /100 | #319 | Tragic 81.7% |
| Colville | 0.0 /100 | #320 | Tragic 81.6% |
| Shoshone | 0.0 /100 | #321 | Tragic 81.6% |
| Kiowa | 0.0 /100 | #322 | Tragic 81.6% |
| Alaska Natives | 0.0 /100 | #323 | Tragic 81.6% |
| Houma | 0.0 /100 | #324 | Tragic 81.2% |
| Dutch West Indians | 0.0 /100 | #325 | Tragic 81.1% |
| Choctaw | 0.0 /100 | #326 | Tragic 81.0% |
| Ute | 0.0 /100 | #327 | Tragic 80.8% |
| Creek | 0.0 /100 | #328 | Tragic 80.7% |
Demographics Similar to Immigrants from Hong Kong by In Labor Force | Age 25-29
In terms of in labor force | age 25-29, the demographic groups most similar to Immigrants from Hong Kong are Czechoslovakian (85.0%, a difference of 0.0%), Immigrants from Zaire (85.1%, a difference of 0.010%), Immigrants from Southern Europe (85.0%, a difference of 0.010%), Immigrants from Japan (85.1%, a difference of 0.020%), and Immigrants from Austria (85.0%, a difference of 0.020%).
| Demographics | Rating | Rank | In Labor Force | Age 25-29 |
| Mongolians | 94.1 /100 | #98 | Exceptional 85.1% |
| Bangladeshis | 94.0 /100 | #99 | Exceptional 85.1% |
| Immigrants | Switzerland | 93.9 /100 | #100 | Exceptional 85.1% |
| Egyptians | 93.8 /100 | #101 | Exceptional 85.1% |
| Slavs | 93.7 /100 | #102 | Exceptional 85.1% |
| Immigrants | Japan | 93.5 /100 | #103 | Exceptional 85.1% |
| Immigrants | Zaire | 93.3 /100 | #104 | Exceptional 85.1% |
| Immigrants | Hong Kong | 92.8 /100 | #105 | Exceptional 85.0% |
| Czechoslovakians | 92.6 /100 | #106 | Exceptional 85.0% |
| Immigrants | Southern Europe | 92.3 /100 | #107 | Exceptional 85.0% |
| Immigrants | Austria | 91.9 /100 | #108 | Exceptional 85.0% |
| Costa Ricans | 91.9 /100 | #109 | Exceptional 85.0% |
| New Zealanders | 91.5 /100 | #110 | Exceptional 85.0% |
| Immigrants | Middle Africa | 91.4 /100 | #111 | Exceptional 85.0% |
| Senegalese | 90.9 /100 | #112 | Exceptional 85.0% |