Shoshone vs Immigrants from Eastern Europe In Labor Force | Age 25-29
COMPARE
Shoshone
Immigrants from Eastern Europe
In Labor Force | Age 25-29
In Labor Force | Age 25-29 Comparison
Shoshone
Immigrants from Eastern Europe
81.6%
IN LABOR FORCE | AGE 25-29
0.0/ 100
METRIC RATING
321st/ 347
METRIC RANK
85.2%
IN LABOR FORCE | AGE 25-29
96.8/ 100
METRIC RATING
84th/ 347
METRIC RANK
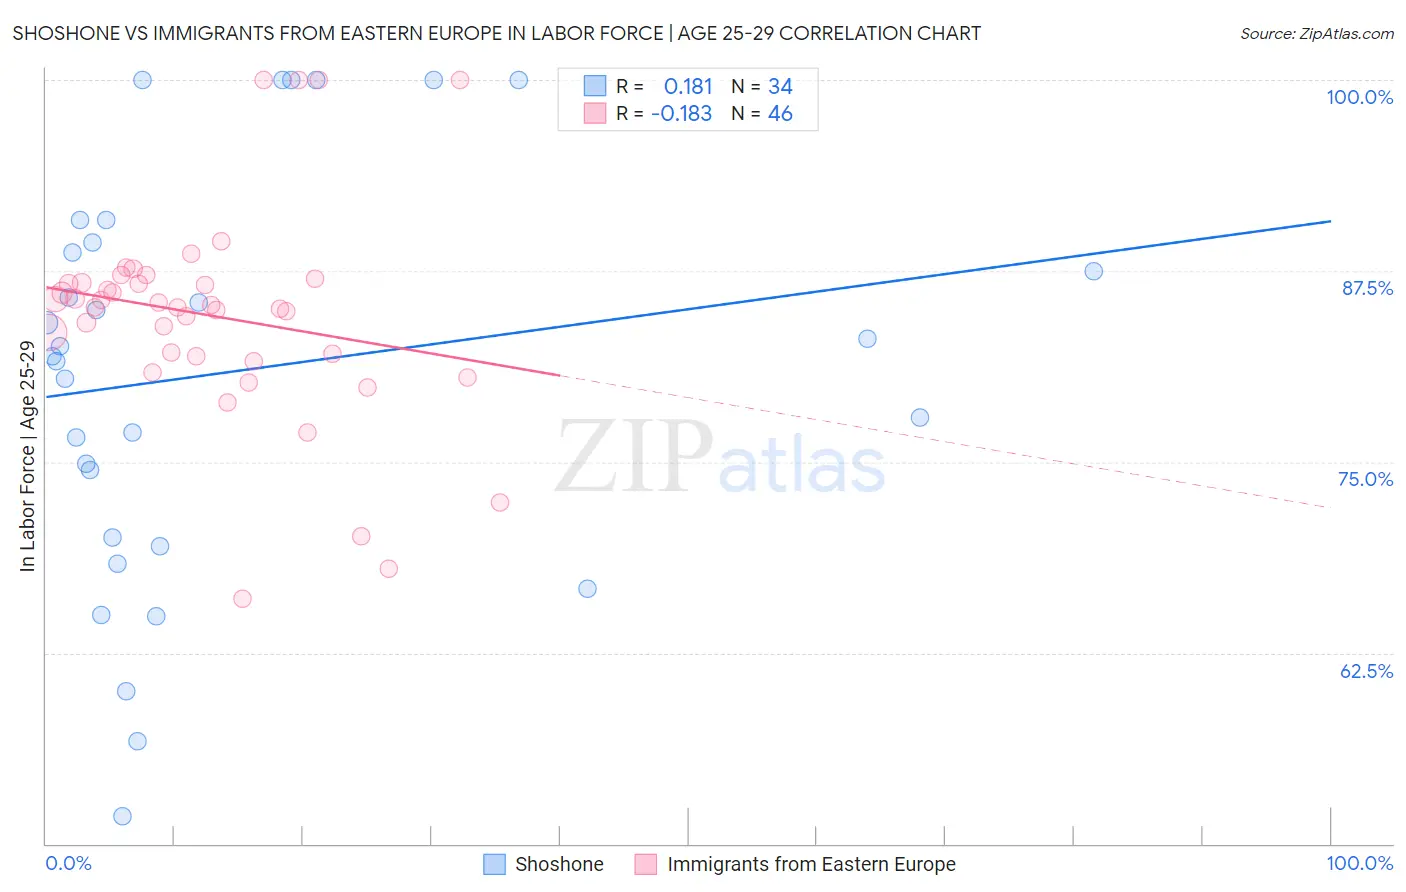
Shoshone vs Immigrants from Eastern Europe In Labor Force | Age 25-29 Correlation Chart
The statistical analysis conducted on geographies consisting of 66,617,603 people shows a poor positive correlation between the proportion of Shoshone and labor force participation rate among population between the ages 25 and 29 in the United States with a correlation coefficient (R) of 0.181 and weighted average of 81.6%. Similarly, the statistical analysis conducted on geographies consisting of 475,521,938 people shows a poor negative correlation between the proportion of Immigrants from Eastern Europe and labor force participation rate among population between the ages 25 and 29 in the United States with a correlation coefficient (R) of -0.183 and weighted average of 85.2%, a difference of 4.4%.
In Labor Force | Age 25-29 Correlation Summary
| Measurement | Shoshone | Immigrants from Eastern Europe |
| Minimum | 51.8% | 66.0% |
| Maximum | 100.0% | 100.0% |
| Range | 48.2% | 34.0% |
| Mean | 80.9% | 84.6% |
| Median | 82.2% | 85.2% |
| Interquartile 25% (IQ1) | 70.1% | 81.9% |
| Interquartile 75% (IQ3) | 89.4% | 86.7% |
| Interquartile Range (IQR) | 19.3% | 4.8% |
| Standard Deviation (Sample) | 13.2% | 7.0% |
| Standard Deviation (Population) | 13.0% | 7.0% |
Similar Demographics by In Labor Force | Age 25-29
Demographics Similar to Shoshone by In Labor Force | Age 25-29
In terms of in labor force | age 25-29, the demographic groups most similar to Shoshone are Kiowa (81.6%, a difference of 0.010%), Colville (81.6%, a difference of 0.060%), Alaska Native (81.6%, a difference of 0.060%), Seminole (81.7%, a difference of 0.11%), and Comanche (81.9%, a difference of 0.32%).
| Demographics | Rating | Rank | In Labor Force | Age 25-29 |
| Cherokee | 0.0 /100 | #314 | Tragic 82.1% |
| Immigrants | Mexico | 0.0 /100 | #315 | Tragic 82.0% |
| Mexicans | 0.0 /100 | #316 | Tragic 81.9% |
| Chickasaw | 0.0 /100 | #317 | Tragic 81.9% |
| Comanche | 0.0 /100 | #318 | Tragic 81.9% |
| Seminole | 0.0 /100 | #319 | Tragic 81.7% |
| Colville | 0.0 /100 | #320 | Tragic 81.6% |
| Shoshone | 0.0 /100 | #321 | Tragic 81.6% |
| Kiowa | 0.0 /100 | #322 | Tragic 81.6% |
| Alaska Natives | 0.0 /100 | #323 | Tragic 81.6% |
| Houma | 0.0 /100 | #324 | Tragic 81.2% |
| Dutch West Indians | 0.0 /100 | #325 | Tragic 81.1% |
| Choctaw | 0.0 /100 | #326 | Tragic 81.0% |
| Ute | 0.0 /100 | #327 | Tragic 80.8% |
| Creek | 0.0 /100 | #328 | Tragic 80.7% |
Demographics Similar to Immigrants from Eastern Europe by In Labor Force | Age 25-29
In terms of in labor force | age 25-29, the demographic groups most similar to Immigrants from Eastern Europe are Immigrants from Europe (85.2%, a difference of 0.0%), Immigrants from Africa (85.2%, a difference of 0.0%), Okinawan (85.2%, a difference of 0.010%), Ukrainian (85.2%, a difference of 0.010%), and French Canadian (85.2%, a difference of 0.010%).
| Demographics | Rating | Rank | In Labor Force | Age 25-29 |
| Immigrants | South Central Asia | 97.9 /100 | #77 | Exceptional 85.2% |
| Immigrants | Egypt | 97.7 /100 | #78 | Exceptional 85.2% |
| Immigrants | Northern Africa | 97.6 /100 | #79 | Exceptional 85.2% |
| Immigrants | Zimbabwe | 97.6 /100 | #80 | Exceptional 85.2% |
| Immigrants | Northern Europe | 97.2 /100 | #81 | Exceptional 85.2% |
| Okinawans | 97.0 /100 | #82 | Exceptional 85.2% |
| Immigrants | Europe | 96.8 /100 | #83 | Exceptional 85.2% |
| Immigrants | Eastern Europe | 96.8 /100 | #84 | Exceptional 85.2% |
| Immigrants | Africa | 96.7 /100 | #85 | Exceptional 85.2% |
| Ukrainians | 96.7 /100 | #86 | Exceptional 85.2% |
| French Canadians | 96.5 /100 | #87 | Exceptional 85.2% |
| Immigrants | Croatia | 96.4 /100 | #88 | Exceptional 85.2% |
| Immigrants | France | 96.3 /100 | #89 | Exceptional 85.2% |
| Burmese | 95.9 /100 | #90 | Exceptional 85.1% |
| Immigrants | Moldova | 95.8 /100 | #91 | Exceptional 85.1% |