Immigrants from Dominica vs Immigrants from Hong Kong In Labor Force | Age 25-29
COMPARE
Immigrants from Dominica
Immigrants from Hong Kong
In Labor Force | Age 25-29
In Labor Force | Age 25-29 Comparison
Immigrants from Dominica
Immigrants from Hong Kong
83.4%
IN LABOR FORCE | AGE 25-29
0.0/ 100
METRIC RATING
273rd/ 347
METRIC RANK
85.0%
IN LABOR FORCE | AGE 25-29
92.8/ 100
METRIC RATING
105th/ 347
METRIC RANK
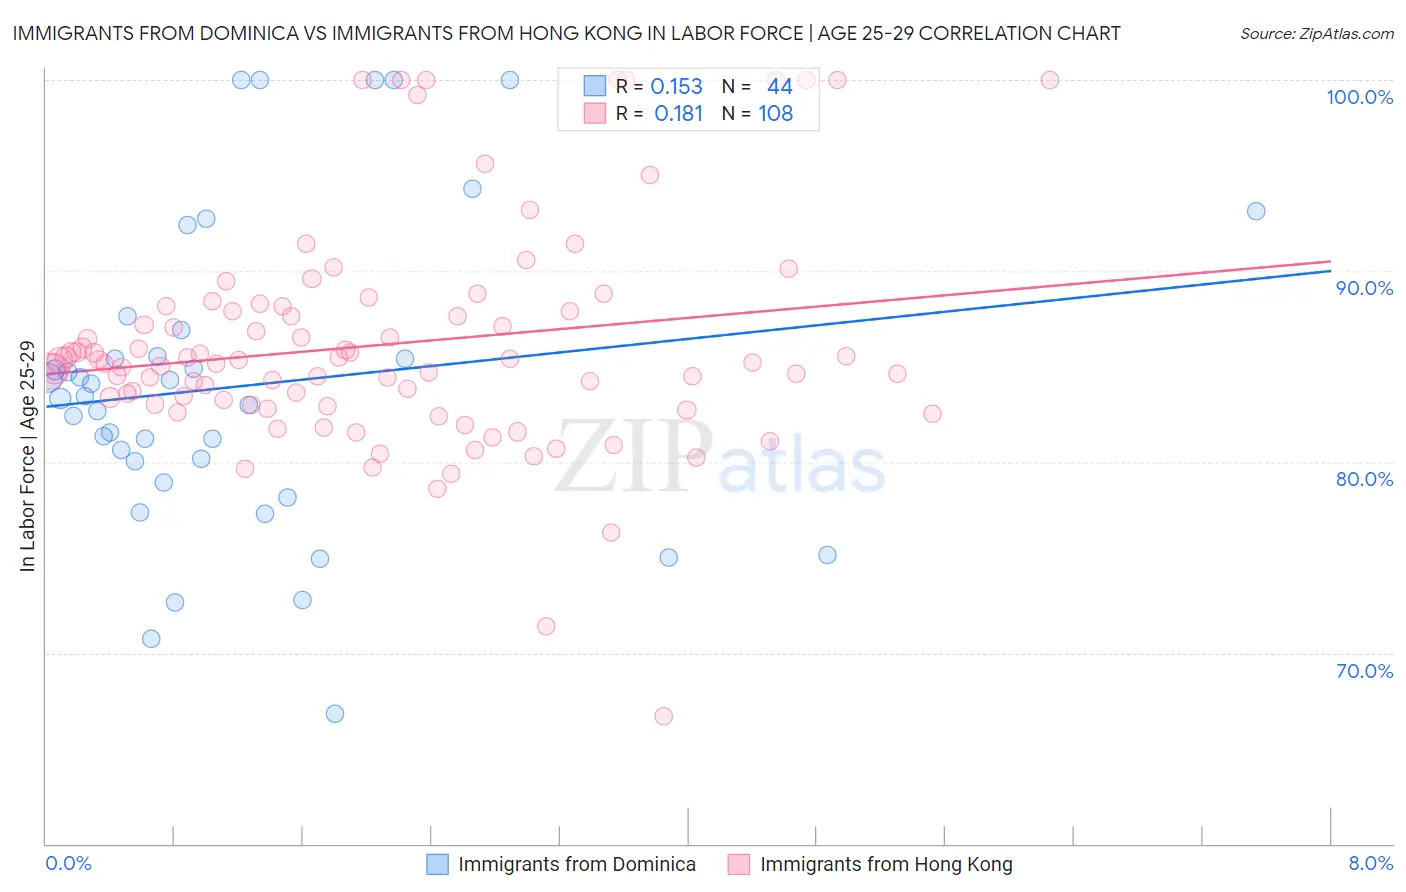
Immigrants from Dominica vs Immigrants from Hong Kong In Labor Force | Age 25-29 Correlation Chart
The statistical analysis conducted on geographies consisting of 83,793,589 people shows a poor positive correlation between the proportion of Immigrants from Dominica and labor force participation rate among population between the ages 25 and 29 in the United States with a correlation coefficient (R) of 0.153 and weighted average of 83.4%. Similarly, the statistical analysis conducted on geographies consisting of 253,942,072 people shows a poor positive correlation between the proportion of Immigrants from Hong Kong and labor force participation rate among population between the ages 25 and 29 in the United States with a correlation coefficient (R) of 0.181 and weighted average of 85.0%, a difference of 2.0%.
In Labor Force | Age 25-29 Correlation Summary
| Measurement | Immigrants from Dominica | Immigrants from Hong Kong |
| Minimum | 66.8% | 66.7% |
| Maximum | 100.0% | 100.0% |
| Range | 33.2% | 33.3% |
| Mean | 84.0% | 86.1% |
| Median | 83.4% | 85.3% |
| Interquartile 25% (IQ1) | 79.5% | 83.0% |
| Interquartile 75% (IQ3) | 86.2% | 88.0% |
| Interquartile Range (IQR) | 6.7% | 5.0% |
| Standard Deviation (Sample) | 8.1% | 5.9% |
| Standard Deviation (Population) | 8.0% | 5.9% |
Similar Demographics by In Labor Force | Age 25-29
Demographics Similar to Immigrants from Dominica by In Labor Force | Age 25-29
In terms of in labor force | age 25-29, the demographic groups most similar to Immigrants from Dominica are Immigrants from Caribbean (83.4%, a difference of 0.0%), Marshallese (83.3%, a difference of 0.030%), Honduran (83.4%, a difference of 0.040%), Basque (83.4%, a difference of 0.060%), and Immigrants from Lebanon (83.4%, a difference of 0.070%).
| Demographics | Rating | Rank | In Labor Force | Age 25-29 |
| Aleuts | 0.0 /100 | #266 | Tragic 83.4% |
| Spanish Americans | 0.0 /100 | #267 | Tragic 83.4% |
| Immigrants | Lebanon | 0.0 /100 | #268 | Tragic 83.4% |
| Immigrants | Barbados | 0.0 /100 | #269 | Tragic 83.4% |
| Basques | 0.0 /100 | #270 | Tragic 83.4% |
| Hondurans | 0.0 /100 | #271 | Tragic 83.4% |
| Immigrants | Caribbean | 0.0 /100 | #272 | Tragic 83.4% |
| Immigrants | Dominica | 0.0 /100 | #273 | Tragic 83.4% |
| Marshallese | 0.0 /100 | #274 | Tragic 83.3% |
| Samoans | 0.0 /100 | #275 | Tragic 83.3% |
| Immigrants | Honduras | 0.0 /100 | #276 | Tragic 83.3% |
| Africans | 0.0 /100 | #277 | Tragic 83.2% |
| Immigrants | Cuba | 0.0 /100 | #278 | Tragic 83.2% |
| British West Indians | 0.0 /100 | #279 | Tragic 83.2% |
| Dominicans | 0.0 /100 | #280 | Tragic 83.2% |
Demographics Similar to Immigrants from Hong Kong by In Labor Force | Age 25-29
In terms of in labor force | age 25-29, the demographic groups most similar to Immigrants from Hong Kong are Czechoslovakian (85.0%, a difference of 0.0%), Immigrants from Zaire (85.1%, a difference of 0.010%), Immigrants from Southern Europe (85.0%, a difference of 0.010%), Immigrants from Japan (85.1%, a difference of 0.020%), and Immigrants from Austria (85.0%, a difference of 0.020%).
| Demographics | Rating | Rank | In Labor Force | Age 25-29 |
| Mongolians | 94.1 /100 | #98 | Exceptional 85.1% |
| Bangladeshis | 94.0 /100 | #99 | Exceptional 85.1% |
| Immigrants | Switzerland | 93.9 /100 | #100 | Exceptional 85.1% |
| Egyptians | 93.8 /100 | #101 | Exceptional 85.1% |
| Slavs | 93.7 /100 | #102 | Exceptional 85.1% |
| Immigrants | Japan | 93.5 /100 | #103 | Exceptional 85.1% |
| Immigrants | Zaire | 93.3 /100 | #104 | Exceptional 85.1% |
| Immigrants | Hong Kong | 92.8 /100 | #105 | Exceptional 85.0% |
| Czechoslovakians | 92.6 /100 | #106 | Exceptional 85.0% |
| Immigrants | Southern Europe | 92.3 /100 | #107 | Exceptional 85.0% |
| Immigrants | Austria | 91.9 /100 | #108 | Exceptional 85.0% |
| Costa Ricans | 91.9 /100 | #109 | Exceptional 85.0% |
| New Zealanders | 91.5 /100 | #110 | Exceptional 85.0% |
| Immigrants | Middle Africa | 91.4 /100 | #111 | Exceptional 85.0% |
| Senegalese | 90.9 /100 | #112 | Exceptional 85.0% |