Shoshone vs Immigrants from Honduras In Labor Force | Age 25-29
COMPARE
Shoshone
Immigrants from Honduras
In Labor Force | Age 25-29
In Labor Force | Age 25-29 Comparison
Shoshone
Immigrants from Honduras
81.6%
IN LABOR FORCE | AGE 25-29
0.0/ 100
METRIC RATING
321st/ 347
METRIC RANK
83.3%
IN LABOR FORCE | AGE 25-29
0.0/ 100
METRIC RATING
276th/ 347
METRIC RANK
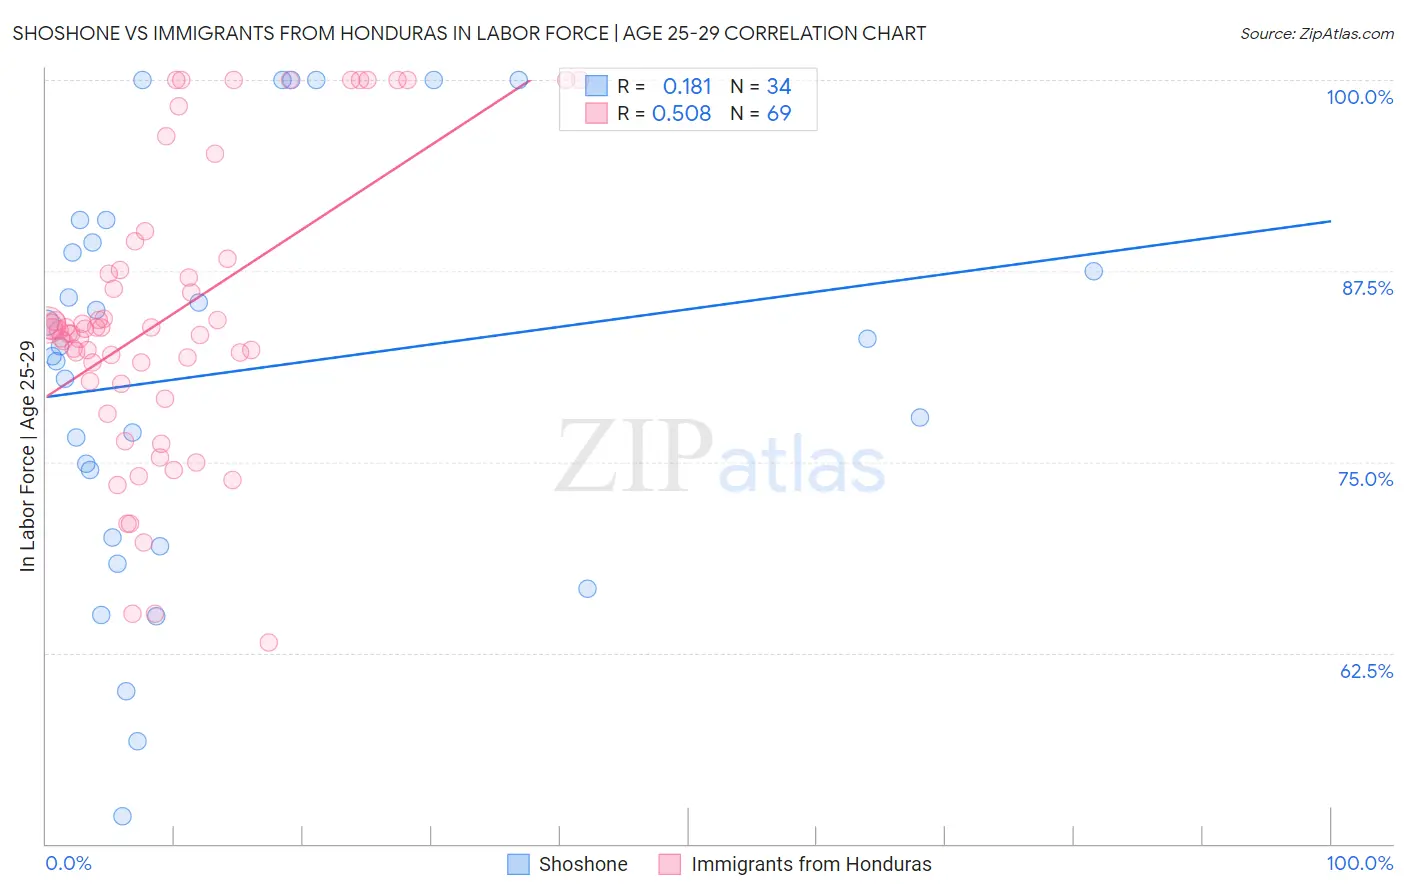
Shoshone vs Immigrants from Honduras In Labor Force | Age 25-29 Correlation Chart
The statistical analysis conducted on geographies consisting of 66,617,603 people shows a poor positive correlation between the proportion of Shoshone and labor force participation rate among population between the ages 25 and 29 in the United States with a correlation coefficient (R) of 0.181 and weighted average of 81.6%. Similarly, the statistical analysis conducted on geographies consisting of 322,539,731 people shows a substantial positive correlation between the proportion of Immigrants from Honduras and labor force participation rate among population between the ages 25 and 29 in the United States with a correlation coefficient (R) of 0.508 and weighted average of 83.3%, a difference of 2.1%.
In Labor Force | Age 25-29 Correlation Summary
| Measurement | Shoshone | Immigrants from Honduras |
| Minimum | 51.8% | 63.2% |
| Maximum | 100.0% | 100.0% |
| Range | 48.2% | 36.8% |
| Mean | 80.9% | 84.4% |
| Median | 82.2% | 83.7% |
| Interquartile 25% (IQ1) | 70.1% | 80.2% |
| Interquartile 75% (IQ3) | 89.4% | 87.9% |
| Interquartile Range (IQR) | 19.3% | 7.7% |
| Standard Deviation (Sample) | 13.2% | 9.3% |
| Standard Deviation (Population) | 13.0% | 9.3% |
Similar Demographics by In Labor Force | Age 25-29
Demographics Similar to Shoshone by In Labor Force | Age 25-29
In terms of in labor force | age 25-29, the demographic groups most similar to Shoshone are Kiowa (81.6%, a difference of 0.010%), Colville (81.6%, a difference of 0.060%), Alaska Native (81.6%, a difference of 0.060%), Seminole (81.7%, a difference of 0.11%), and Comanche (81.9%, a difference of 0.32%).
| Demographics | Rating | Rank | In Labor Force | Age 25-29 |
| Cherokee | 0.0 /100 | #314 | Tragic 82.1% |
| Immigrants | Mexico | 0.0 /100 | #315 | Tragic 82.0% |
| Mexicans | 0.0 /100 | #316 | Tragic 81.9% |
| Chickasaw | 0.0 /100 | #317 | Tragic 81.9% |
| Comanche | 0.0 /100 | #318 | Tragic 81.9% |
| Seminole | 0.0 /100 | #319 | Tragic 81.7% |
| Colville | 0.0 /100 | #320 | Tragic 81.6% |
| Shoshone | 0.0 /100 | #321 | Tragic 81.6% |
| Kiowa | 0.0 /100 | #322 | Tragic 81.6% |
| Alaska Natives | 0.0 /100 | #323 | Tragic 81.6% |
| Houma | 0.0 /100 | #324 | Tragic 81.2% |
| Dutch West Indians | 0.0 /100 | #325 | Tragic 81.1% |
| Choctaw | 0.0 /100 | #326 | Tragic 81.0% |
| Ute | 0.0 /100 | #327 | Tragic 80.8% |
| Creek | 0.0 /100 | #328 | Tragic 80.7% |
Demographics Similar to Immigrants from Honduras by In Labor Force | Age 25-29
In terms of in labor force | age 25-29, the demographic groups most similar to Immigrants from Honduras are Samoan (83.3%, a difference of 0.0%), Marshallese (83.3%, a difference of 0.050%), Immigrants from Dominica (83.4%, a difference of 0.070%), African (83.2%, a difference of 0.070%), and Immigrants from Caribbean (83.4%, a difference of 0.080%).
| Demographics | Rating | Rank | In Labor Force | Age 25-29 |
| Immigrants | Barbados | 0.0 /100 | #269 | Tragic 83.4% |
| Basques | 0.0 /100 | #270 | Tragic 83.4% |
| Hondurans | 0.0 /100 | #271 | Tragic 83.4% |
| Immigrants | Caribbean | 0.0 /100 | #272 | Tragic 83.4% |
| Immigrants | Dominica | 0.0 /100 | #273 | Tragic 83.4% |
| Marshallese | 0.0 /100 | #274 | Tragic 83.3% |
| Samoans | 0.0 /100 | #275 | Tragic 83.3% |
| Immigrants | Honduras | 0.0 /100 | #276 | Tragic 83.3% |
| Africans | 0.0 /100 | #277 | Tragic 83.2% |
| Immigrants | Cuba | 0.0 /100 | #278 | Tragic 83.2% |
| British West Indians | 0.0 /100 | #279 | Tragic 83.2% |
| Dominicans | 0.0 /100 | #280 | Tragic 83.2% |
| Immigrants | Dominican Republic | 0.0 /100 | #281 | Tragic 83.1% |
| Americans | 0.0 /100 | #282 | Tragic 83.1% |
| Immigrants | Azores | 0.0 /100 | #283 | Tragic 83.1% |