Shoshone vs Immigrants from Hong Kong Master's Degree
COMPARE
Shoshone
Immigrants from Hong Kong
Master's Degree
Master's Degree Comparison
Shoshone
Immigrants from Hong Kong
11.1%
MASTER'S DEGREE
0.0/ 100
METRIC RATING
310th/ 347
METRIC RANK
20.5%
MASTER'S DEGREE
100.0/ 100
METRIC RATING
19th/ 347
METRIC RANK
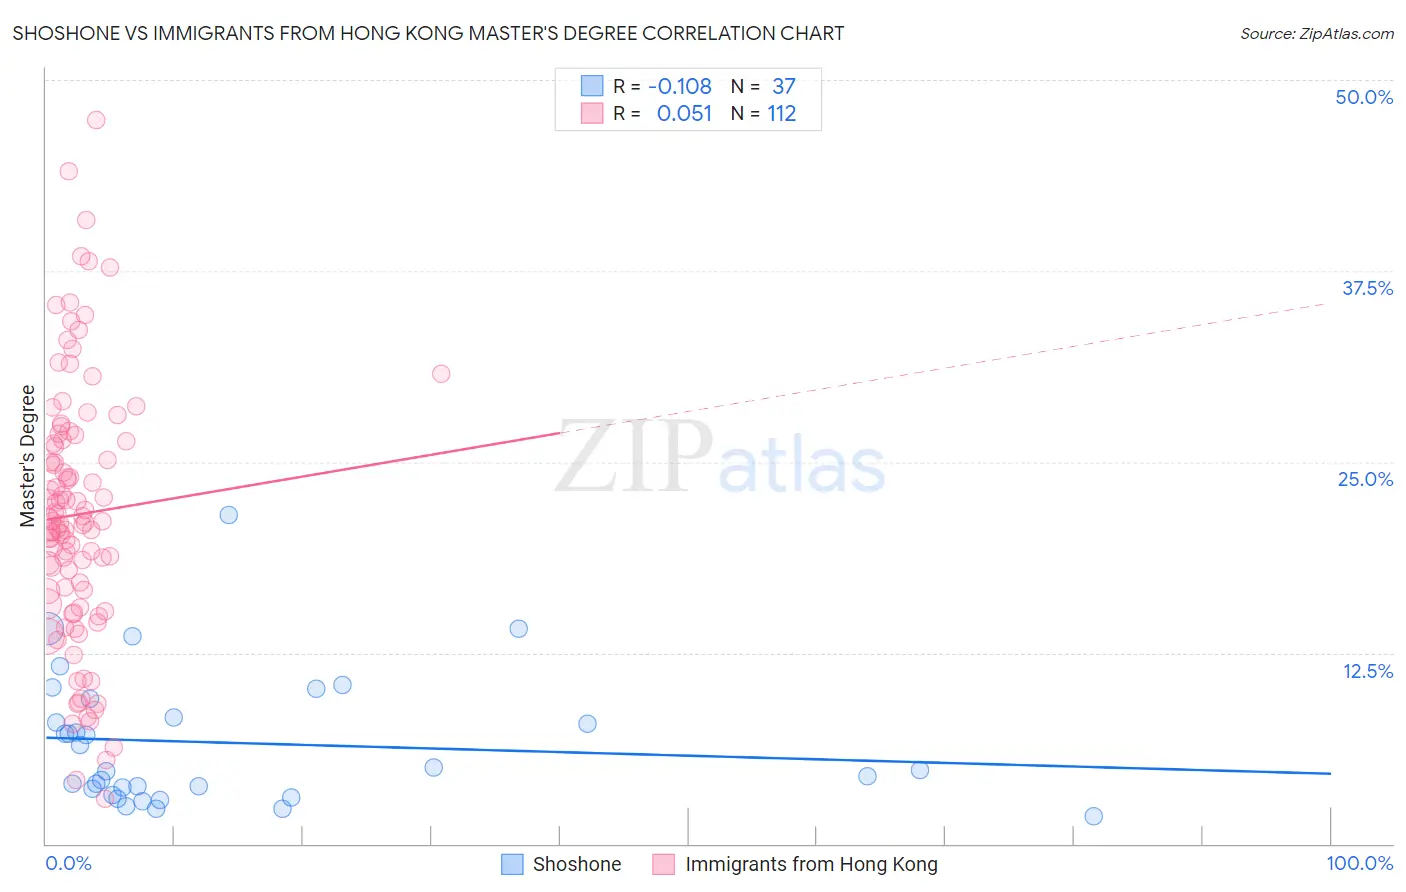
Shoshone vs Immigrants from Hong Kong Master's Degree Correlation Chart
The statistical analysis conducted on geographies consisting of 66,620,223 people shows a poor negative correlation between the proportion of Shoshone and percentage of population with at least master's degree education in the United States with a correlation coefficient (R) of -0.108 and weighted average of 11.1%. Similarly, the statistical analysis conducted on geographies consisting of 253,947,811 people shows a slight positive correlation between the proportion of Immigrants from Hong Kong and percentage of population with at least master's degree education in the United States with a correlation coefficient (R) of 0.051 and weighted average of 20.5%, a difference of 84.3%.
Master's Degree Correlation Summary
| Measurement | Shoshone | Immigrants from Hong Kong |
| Minimum | 1.8% | 2.9% |
| Maximum | 21.5% | 47.4% |
| Range | 19.7% | 44.5% |
| Mean | 6.6% | 21.6% |
| Median | 4.9% | 21.1% |
| Interquartile 25% (IQ1) | 3.4% | 16.1% |
| Interquartile 75% (IQ3) | 8.9% | 26.4% |
| Interquartile Range (IQR) | 5.5% | 10.3% |
| Standard Deviation (Sample) | 4.3% | 8.5% |
| Standard Deviation (Population) | 4.3% | 8.5% |
Similar Demographics by Master's Degree
Demographics Similar to Shoshone by Master's Degree
In terms of master's degree, the demographic groups most similar to Shoshone are Puget Sound Salish (11.1%, a difference of 0.36%), Seminole (11.0%, a difference of 0.51%), Choctaw (11.0%, a difference of 0.61%), Puerto Rican (11.2%, a difference of 0.65%), and Yaqui (11.0%, a difference of 0.79%).
| Demographics | Rating | Rank | Master's Degree |
| Immigrants | Laos | 0.1 /100 | #303 | Tragic 11.4% |
| Immigrants | Cabo Verde | 0.1 /100 | #304 | Tragic 11.3% |
| Immigrants | Latin America | 0.0 /100 | #305 | Tragic 11.3% |
| Mexican American Indians | 0.0 /100 | #306 | Tragic 11.2% |
| Cheyenne | 0.0 /100 | #307 | Tragic 11.2% |
| Puerto Ricans | 0.0 /100 | #308 | Tragic 11.2% |
| Puget Sound Salish | 0.0 /100 | #309 | Tragic 11.1% |
| Shoshone | 0.0 /100 | #310 | Tragic 11.1% |
| Seminole | 0.0 /100 | #311 | Tragic 11.0% |
| Choctaw | 0.0 /100 | #312 | Tragic 11.0% |
| Yaqui | 0.0 /100 | #313 | Tragic 11.0% |
| Cajuns | 0.0 /100 | #314 | Tragic 11.0% |
| Apache | 0.0 /100 | #315 | Tragic 11.0% |
| Hispanics or Latinos | 0.0 /100 | #316 | Tragic 10.9% |
| Hopi | 0.0 /100 | #317 | Tragic 10.9% |
Demographics Similar to Immigrants from Hong Kong by Master's Degree
In terms of master's degree, the demographic groups most similar to Immigrants from Hong Kong are Indian (Asian) (20.5%, a difference of 0.020%), Immigrants from Ireland (20.4%, a difference of 0.13%), Soviet Union (20.5%, a difference of 0.35%), Israeli (20.3%, a difference of 0.55%), and Immigrants from France (20.3%, a difference of 0.83%).
| Demographics | Rating | Rank | Master's Degree |
| Eastern Europeans | 100.0 /100 | #12 | Exceptional 21.1% |
| Immigrants | Australia | 100.0 /100 | #13 | Exceptional 20.9% |
| Immigrants | Switzerland | 100.0 /100 | #14 | Exceptional 20.9% |
| Immigrants | Eastern Asia | 100.0 /100 | #15 | Exceptional 20.8% |
| Immigrants | Belgium | 100.0 /100 | #16 | Exceptional 20.8% |
| Immigrants | South Central Asia | 100.0 /100 | #17 | Exceptional 20.7% |
| Soviet Union | 100.0 /100 | #18 | Exceptional 20.5% |
| Immigrants | Hong Kong | 100.0 /100 | #19 | Exceptional 20.5% |
| Indians (Asian) | 100.0 /100 | #20 | Exceptional 20.5% |
| Immigrants | Ireland | 100.0 /100 | #21 | Exceptional 20.4% |
| Israelis | 100.0 /100 | #22 | Exceptional 20.3% |
| Immigrants | France | 100.0 /100 | #23 | Exceptional 20.3% |
| Immigrants | Sweden | 100.0 /100 | #24 | Exceptional 20.3% |
| Immigrants | Japan | 100.0 /100 | #25 | Exceptional 20.0% |
| Cambodians | 100.0 /100 | #26 | Exceptional 20.0% |