Haitian vs Immigrants from Hong Kong In Labor Force | Age 25-29
COMPARE
Haitian
Immigrants from Hong Kong
In Labor Force | Age 25-29
In Labor Force | Age 25-29 Comparison
Haitians
Immigrants from Hong Kong
83.7%
IN LABOR FORCE | AGE 25-29
0.2/ 100
METRIC RATING
255th/ 347
METRIC RANK
85.0%
IN LABOR FORCE | AGE 25-29
92.8/ 100
METRIC RATING
105th/ 347
METRIC RANK
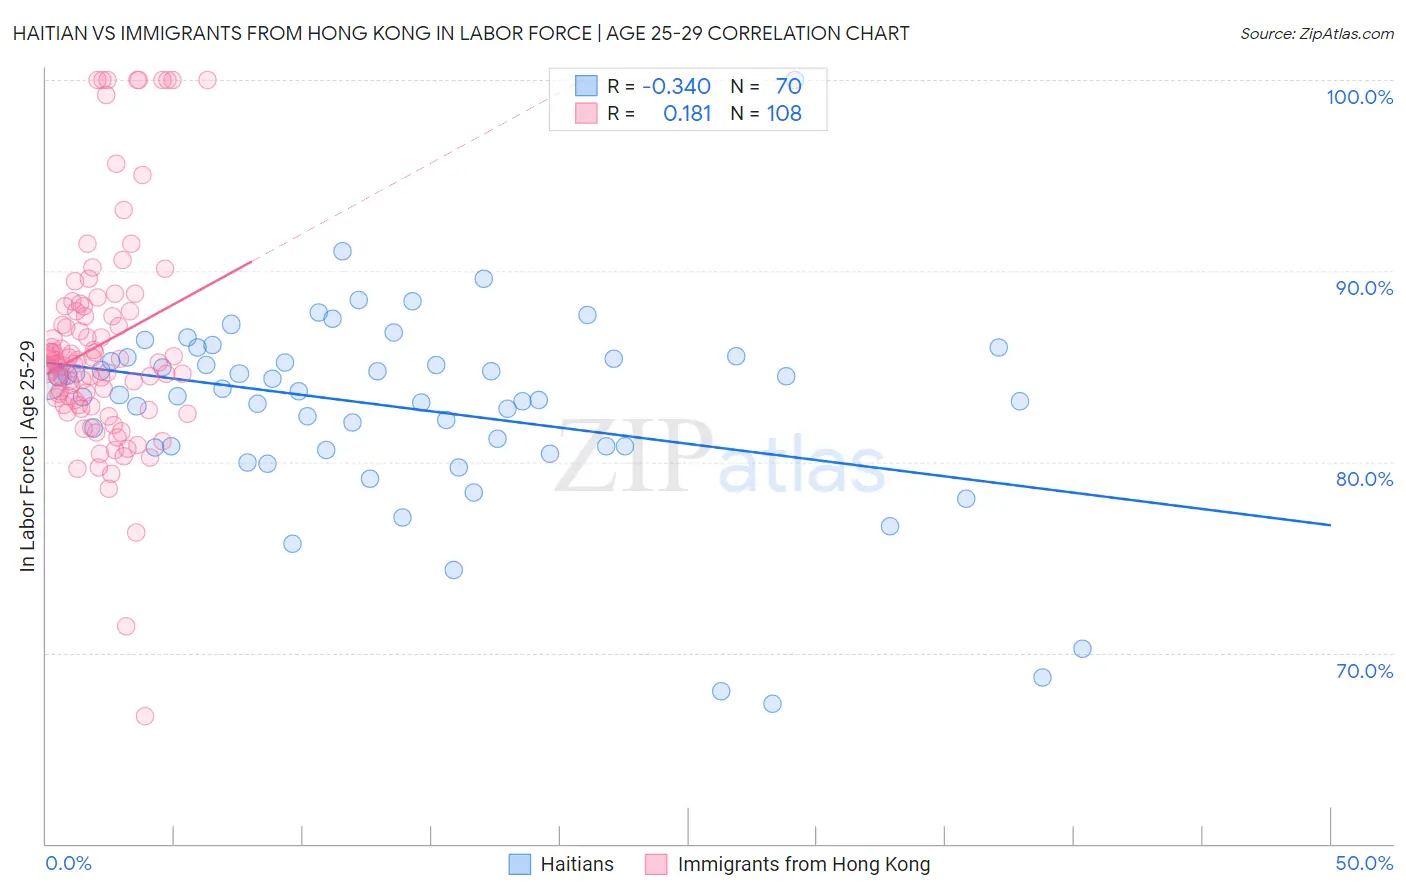
Haitian vs Immigrants from Hong Kong In Labor Force | Age 25-29 Correlation Chart
The statistical analysis conducted on geographies consisting of 287,877,051 people shows a mild negative correlation between the proportion of Haitians and labor force participation rate among population between the ages 25 and 29 in the United States with a correlation coefficient (R) of -0.340 and weighted average of 83.7%. Similarly, the statistical analysis conducted on geographies consisting of 253,942,072 people shows a poor positive correlation between the proportion of Immigrants from Hong Kong and labor force participation rate among population between the ages 25 and 29 in the United States with a correlation coefficient (R) of 0.181 and weighted average of 85.0%, a difference of 1.7%.
In Labor Force | Age 25-29 Correlation Summary
| Measurement | Haitian | Immigrants from Hong Kong |
| Minimum | 67.3% | 66.7% |
| Maximum | 100.0% | 100.0% |
| Range | 32.7% | 33.3% |
| Mean | 82.8% | 86.1% |
| Median | 83.6% | 85.3% |
| Interquartile 25% (IQ1) | 80.8% | 83.0% |
| Interquartile 75% (IQ3) | 85.4% | 88.0% |
| Interquartile Range (IQR) | 4.6% | 5.0% |
| Standard Deviation (Sample) | 5.2% | 5.9% |
| Standard Deviation (Population) | 5.1% | 5.9% |
Similar Demographics by In Labor Force | Age 25-29
Demographics Similar to Haitians by In Labor Force | Age 25-29
In terms of in labor force | age 25-29, the demographic groups most similar to Haitians are Immigrants from Trinidad and Tobago (83.7%, a difference of 0.010%), Spaniard (83.7%, a difference of 0.010%), Immigrants from Haiti (83.7%, a difference of 0.010%), Guatemalan (83.7%, a difference of 0.020%), and Delaware (83.7%, a difference of 0.020%).
| Demographics | Rating | Rank | In Labor Force | Age 25-29 |
| Immigrants | Nonimmigrants | 0.3 /100 | #248 | Tragic 83.7% |
| Hmong | 0.3 /100 | #249 | Tragic 83.7% |
| Central Americans | 0.2 /100 | #250 | Tragic 83.7% |
| Bahamians | 0.2 /100 | #251 | Tragic 83.7% |
| Guatemalans | 0.2 /100 | #252 | Tragic 83.7% |
| Immigrants | Trinidad and Tobago | 0.2 /100 | #253 | Tragic 83.7% |
| Spaniards | 0.2 /100 | #254 | Tragic 83.7% |
| Haitians | 0.2 /100 | #255 | Tragic 83.7% |
| Immigrants | Haiti | 0.2 /100 | #256 | Tragic 83.7% |
| Delaware | 0.2 /100 | #257 | Tragic 83.7% |
| Immigrants | Guatemala | 0.1 /100 | #258 | Tragic 83.6% |
| Spanish | 0.1 /100 | #259 | Tragic 83.6% |
| Immigrants | Bahamas | 0.1 /100 | #260 | Tragic 83.6% |
| Pennsylvania Germans | 0.1 /100 | #261 | Tragic 83.6% |
| Immigrants | Fiji | 0.1 /100 | #262 | Tragic 83.6% |
Demographics Similar to Immigrants from Hong Kong by In Labor Force | Age 25-29
In terms of in labor force | age 25-29, the demographic groups most similar to Immigrants from Hong Kong are Czechoslovakian (85.0%, a difference of 0.0%), Immigrants from Zaire (85.1%, a difference of 0.010%), Immigrants from Southern Europe (85.0%, a difference of 0.010%), Immigrants from Japan (85.1%, a difference of 0.020%), and Immigrants from Austria (85.0%, a difference of 0.020%).
| Demographics | Rating | Rank | In Labor Force | Age 25-29 |
| Mongolians | 94.1 /100 | #98 | Exceptional 85.1% |
| Bangladeshis | 94.0 /100 | #99 | Exceptional 85.1% |
| Immigrants | Switzerland | 93.9 /100 | #100 | Exceptional 85.1% |
| Egyptians | 93.8 /100 | #101 | Exceptional 85.1% |
| Slavs | 93.7 /100 | #102 | Exceptional 85.1% |
| Immigrants | Japan | 93.5 /100 | #103 | Exceptional 85.1% |
| Immigrants | Zaire | 93.3 /100 | #104 | Exceptional 85.1% |
| Immigrants | Hong Kong | 92.8 /100 | #105 | Exceptional 85.0% |
| Czechoslovakians | 92.6 /100 | #106 | Exceptional 85.0% |
| Immigrants | Southern Europe | 92.3 /100 | #107 | Exceptional 85.0% |
| Immigrants | Austria | 91.9 /100 | #108 | Exceptional 85.0% |
| Costa Ricans | 91.9 /100 | #109 | Exceptional 85.0% |
| New Zealanders | 91.5 /100 | #110 | Exceptional 85.0% |
| Immigrants | Middle Africa | 91.4 /100 | #111 | Exceptional 85.0% |
| Senegalese | 90.9 /100 | #112 | Exceptional 85.0% |