Shoshone vs Immigrants from Hong Kong Unemployment
COMPARE
Shoshone
Immigrants from Hong Kong
Unemployment
Unemployment Comparison
Shoshone
Immigrants from Hong Kong
6.8%
UNEMPLOYMENT
0.0/ 100
METRIC RATING
317th/ 347
METRIC RANK
5.2%
UNEMPLOYMENT
75.2/ 100
METRIC RATING
152nd/ 347
METRIC RANK
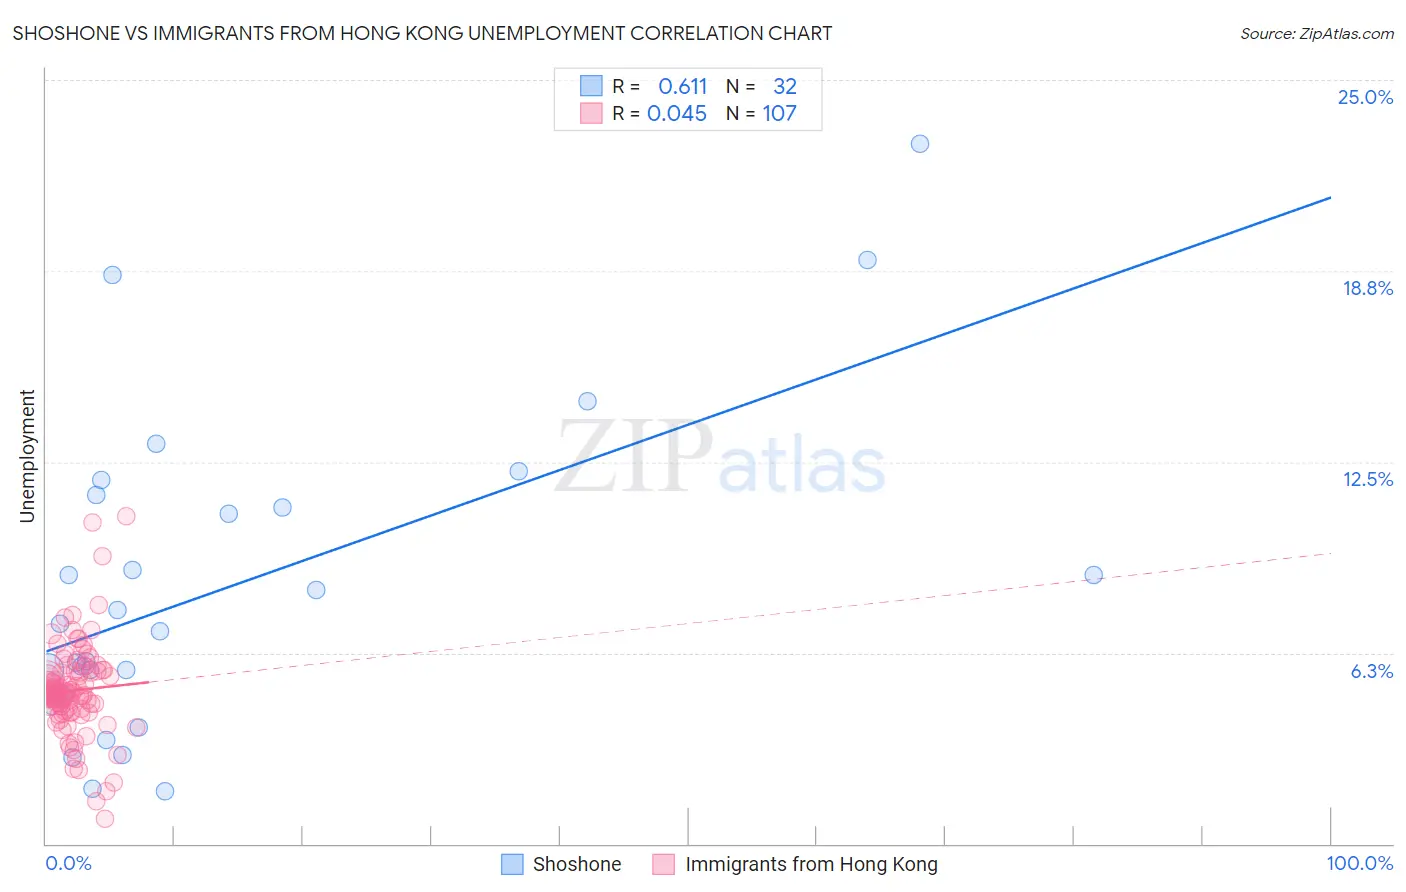
Shoshone vs Immigrants from Hong Kong Unemployment Correlation Chart
The statistical analysis conducted on geographies consisting of 66,583,051 people shows a significant positive correlation between the proportion of Shoshone and unemployment in the United States with a correlation coefficient (R) of 0.611 and weighted average of 6.8%. Similarly, the statistical analysis conducted on geographies consisting of 253,937,877 people shows no correlation between the proportion of Immigrants from Hong Kong and unemployment in the United States with a correlation coefficient (R) of 0.045 and weighted average of 5.2%, a difference of 31.2%.
Unemployment Correlation Summary
| Measurement | Shoshone | Immigrants from Hong Kong |
| Minimum | 1.7% | 0.80% |
| Maximum | 22.9% | 10.7% |
| Range | 21.2% | 9.9% |
| Mean | 8.4% | 5.0% |
| Median | 7.1% | 4.9% |
| Interquartile 25% (IQ1) | 4.8% | 4.4% |
| Interquartile 75% (IQ3) | 11.2% | 5.6% |
| Interquartile Range (IQR) | 6.4% | 1.2% |
| Standard Deviation (Sample) | 5.1% | 1.5% |
| Standard Deviation (Population) | 5.1% | 1.5% |
Similar Demographics by Unemployment
Demographics Similar to Shoshone by Unemployment
In terms of unemployment, the demographic groups most similar to Shoshone are Immigrants from Dominica (6.7%, a difference of 0.58%), Immigrants from Cabo Verde (6.8%, a difference of 0.60%), British West Indian (6.8%, a difference of 0.81%), Houma (6.7%, a difference of 1.4%), and Immigrants from St. Vincent and the Grenadines (6.9%, a difference of 1.6%).
| Demographics | Rating | Rank | Unemployment |
| Immigrants | Belize | 0.0 /100 | #310 | Tragic 6.5% |
| Cape Verdeans | 0.0 /100 | #311 | Tragic 6.5% |
| Colville | 0.0 /100 | #312 | Tragic 6.6% |
| Immigrants | Barbados | 0.0 /100 | #313 | Tragic 6.6% |
| Blacks/African Americans | 0.0 /100 | #314 | Tragic 6.6% |
| Houma | 0.0 /100 | #315 | Tragic 6.7% |
| Immigrants | Dominica | 0.0 /100 | #316 | Tragic 6.7% |
| Shoshone | 0.0 /100 | #317 | Tragic 6.8% |
| Immigrants | Cabo Verde | 0.0 /100 | #318 | Tragic 6.8% |
| British West Indians | 0.0 /100 | #319 | Tragic 6.8% |
| Immigrants | St. Vincent and the Grenadines | 0.0 /100 | #320 | Tragic 6.9% |
| Immigrants | Guyana | 0.0 /100 | #321 | Tragic 6.9% |
| Guyanese | 0.0 /100 | #322 | Tragic 6.9% |
| Immigrants | Grenada | 0.0 /100 | #323 | Tragic 6.9% |
| Immigrants | Armenia | 0.0 /100 | #324 | Tragic 7.0% |
Demographics Similar to Immigrants from Hong Kong by Unemployment
In terms of unemployment, the demographic groups most similar to Immigrants from Hong Kong are Egyptian (5.2%, a difference of 0.0%), Immigrants from Eastern Europe (5.2%, a difference of 0.010%), Immigrants from China (5.2%, a difference of 0.040%), Potawatomi (5.2%, a difference of 0.080%), and Syrian (5.2%, a difference of 0.22%).
| Demographics | Rating | Rank | Unemployment |
| Immigrants | Norway | 81.8 /100 | #145 | Excellent 5.1% |
| Immigrants | Asia | 81.8 /100 | #146 | Excellent 5.1% |
| Indians (Asian) | 81.6 /100 | #147 | Excellent 5.1% |
| Immigrants | Italy | 79.1 /100 | #148 | Good 5.1% |
| Syrians | 77.7 /100 | #149 | Good 5.2% |
| Potawatomi | 76.2 /100 | #150 | Good 5.2% |
| Immigrants | Eastern Europe | 75.3 /100 | #151 | Good 5.2% |
| Immigrants | Hong Kong | 75.2 /100 | #152 | Good 5.2% |
| Egyptians | 75.2 /100 | #153 | Good 5.2% |
| Immigrants | China | 74.7 /100 | #154 | Good 5.2% |
| Immigrants | Northern Africa | 71.3 /100 | #155 | Good 5.2% |
| Immigrants | Kazakhstan | 70.4 /100 | #156 | Good 5.2% |
| Sri Lankans | 69.5 /100 | #157 | Good 5.2% |
| Immigrants | Egypt | 66.7 /100 | #158 | Good 5.2% |
| Immigrants | Russia | 66.6 /100 | #159 | Good 5.2% |