Greek vs Immigrants from Hong Kong In Labor Force | Age 25-29
COMPARE
Greek
Immigrants from Hong Kong
In Labor Force | Age 25-29
In Labor Force | Age 25-29 Comparison
Greeks
Immigrants from Hong Kong
85.5%
IN LABOR FORCE | AGE 25-29
99.6/ 100
METRIC RATING
58th/ 347
METRIC RANK
85.0%
IN LABOR FORCE | AGE 25-29
92.8/ 100
METRIC RATING
105th/ 347
METRIC RANK
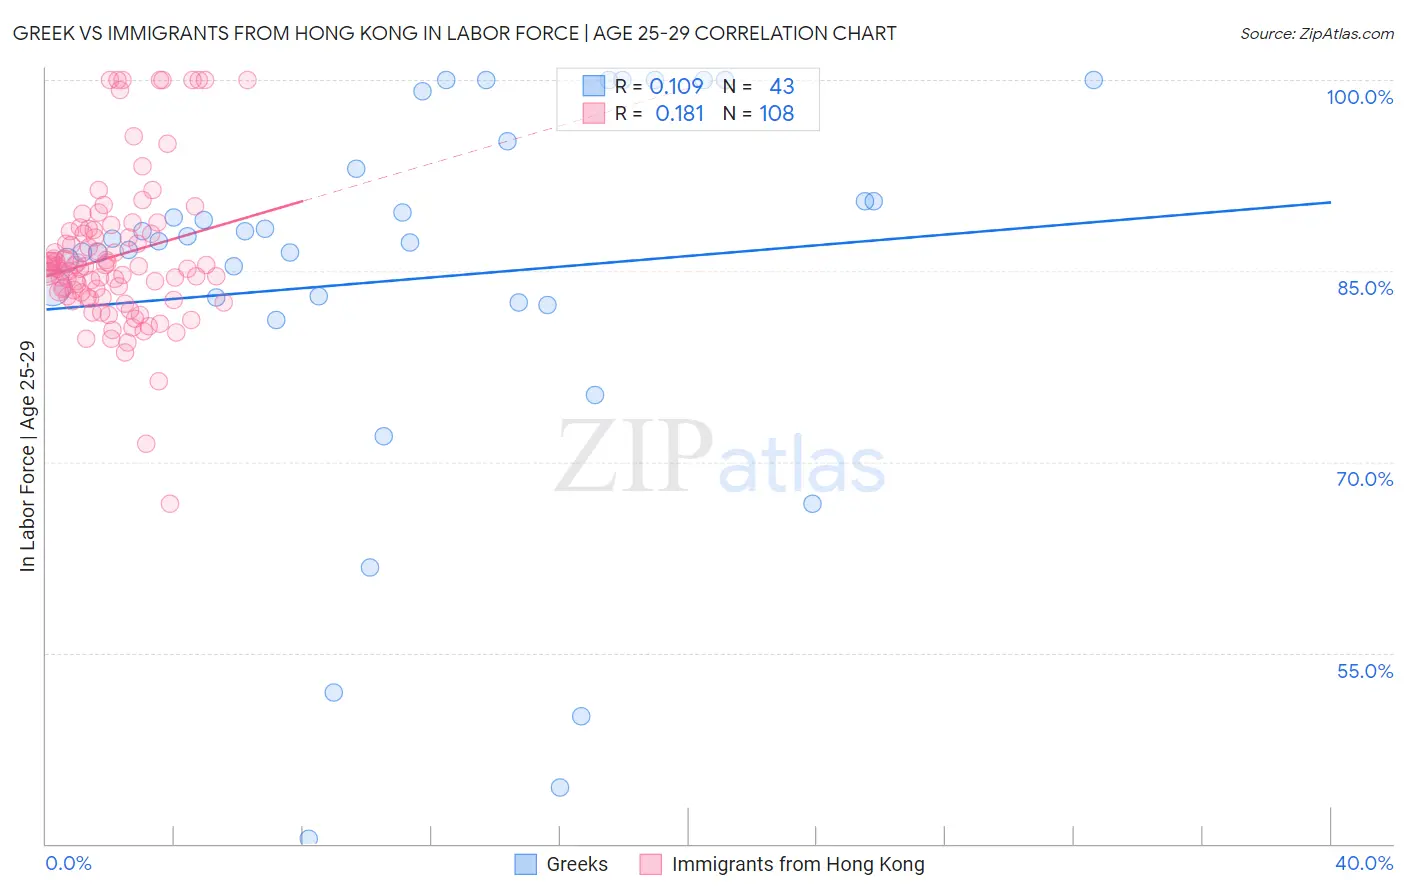
Greek vs Immigrants from Hong Kong In Labor Force | Age 25-29 Correlation Chart
The statistical analysis conducted on geographies consisting of 482,434,126 people shows a poor positive correlation between the proportion of Greeks and labor force participation rate among population between the ages 25 and 29 in the United States with a correlation coefficient (R) of 0.109 and weighted average of 85.5%. Similarly, the statistical analysis conducted on geographies consisting of 253,942,072 people shows a poor positive correlation between the proportion of Immigrants from Hong Kong and labor force participation rate among population between the ages 25 and 29 in the United States with a correlation coefficient (R) of 0.181 and weighted average of 85.0%, a difference of 0.52%.
In Labor Force | Age 25-29 Correlation Summary
| Measurement | Greek | Immigrants from Hong Kong |
| Minimum | 40.4% | 66.7% |
| Maximum | 100.0% | 100.0% |
| Range | 59.6% | 33.3% |
| Mean | 84.3% | 86.1% |
| Median | 87.3% | 85.3% |
| Interquartile 25% (IQ1) | 82.6% | 83.0% |
| Interquartile 75% (IQ3) | 93.1% | 88.0% |
| Interquartile Range (IQR) | 10.5% | 5.0% |
| Standard Deviation (Sample) | 15.0% | 5.9% |
| Standard Deviation (Population) | 14.8% | 5.9% |
Similar Demographics by In Labor Force | Age 25-29
Demographics Similar to Greeks by In Labor Force | Age 25-29
In terms of in labor force | age 25-29, the demographic groups most similar to Greeks are Eastern European (85.5%, a difference of 0.010%), Estonian (85.5%, a difference of 0.010%), Immigrants from Morocco (85.5%, a difference of 0.010%), Thai (85.5%, a difference of 0.040%), and Serbian (85.5%, a difference of 0.040%).
| Demographics | Rating | Rank | In Labor Force | Age 25-29 |
| Immigrants | Latvia | 99.8 /100 | #51 | Exceptional 85.6% |
| Immigrants | Poland | 99.7 /100 | #52 | Exceptional 85.6% |
| Belgians | 99.7 /100 | #53 | Exceptional 85.5% |
| Albanians | 99.7 /100 | #54 | Exceptional 85.5% |
| Immigrants | Brazil | 99.7 /100 | #55 | Exceptional 85.5% |
| Eastern Europeans | 99.6 /100 | #56 | Exceptional 85.5% |
| Estonians | 99.6 /100 | #57 | Exceptional 85.5% |
| Greeks | 99.6 /100 | #58 | Exceptional 85.5% |
| Immigrants | Morocco | 99.5 /100 | #59 | Exceptional 85.5% |
| Thais | 99.5 /100 | #60 | Exceptional 85.5% |
| Serbians | 99.5 /100 | #61 | Exceptional 85.5% |
| Taiwanese | 99.4 /100 | #62 | Exceptional 85.4% |
| Immigrants | Kenya | 99.4 /100 | #63 | Exceptional 85.4% |
| Immigrants | Italy | 99.3 /100 | #64 | Exceptional 85.4% |
| Immigrants | Czechoslovakia | 99.3 /100 | #65 | Exceptional 85.4% |
Demographics Similar to Immigrants from Hong Kong by In Labor Force | Age 25-29
In terms of in labor force | age 25-29, the demographic groups most similar to Immigrants from Hong Kong are Czechoslovakian (85.0%, a difference of 0.0%), Immigrants from Zaire (85.1%, a difference of 0.010%), Immigrants from Southern Europe (85.0%, a difference of 0.010%), Immigrants from Japan (85.1%, a difference of 0.020%), and Immigrants from Austria (85.0%, a difference of 0.020%).
| Demographics | Rating | Rank | In Labor Force | Age 25-29 |
| Mongolians | 94.1 /100 | #98 | Exceptional 85.1% |
| Bangladeshis | 94.0 /100 | #99 | Exceptional 85.1% |
| Immigrants | Switzerland | 93.9 /100 | #100 | Exceptional 85.1% |
| Egyptians | 93.8 /100 | #101 | Exceptional 85.1% |
| Slavs | 93.7 /100 | #102 | Exceptional 85.1% |
| Immigrants | Japan | 93.5 /100 | #103 | Exceptional 85.1% |
| Immigrants | Zaire | 93.3 /100 | #104 | Exceptional 85.1% |
| Immigrants | Hong Kong | 92.8 /100 | #105 | Exceptional 85.0% |
| Czechoslovakians | 92.6 /100 | #106 | Exceptional 85.0% |
| Immigrants | Southern Europe | 92.3 /100 | #107 | Exceptional 85.0% |
| Immigrants | Austria | 91.9 /100 | #108 | Exceptional 85.0% |
| Costa Ricans | 91.9 /100 | #109 | Exceptional 85.0% |
| New Zealanders | 91.5 /100 | #110 | Exceptional 85.0% |
| Immigrants | Middle Africa | 91.4 /100 | #111 | Exceptional 85.0% |
| Senegalese | 90.9 /100 | #112 | Exceptional 85.0% |