Senegalese vs Nigerian In Labor Force | Age 25-29
COMPARE
Senegalese
Nigerian
In Labor Force | Age 25-29
In Labor Force | Age 25-29 Comparison
Senegalese
Nigerians
85.0%
IN LABOR FORCE | AGE 25-29
90.9/ 100
METRIC RATING
112th/ 347
METRIC RANK
84.3%
IN LABOR FORCE | AGE 25-29
7.2/ 100
METRIC RATING
220th/ 347
METRIC RANK
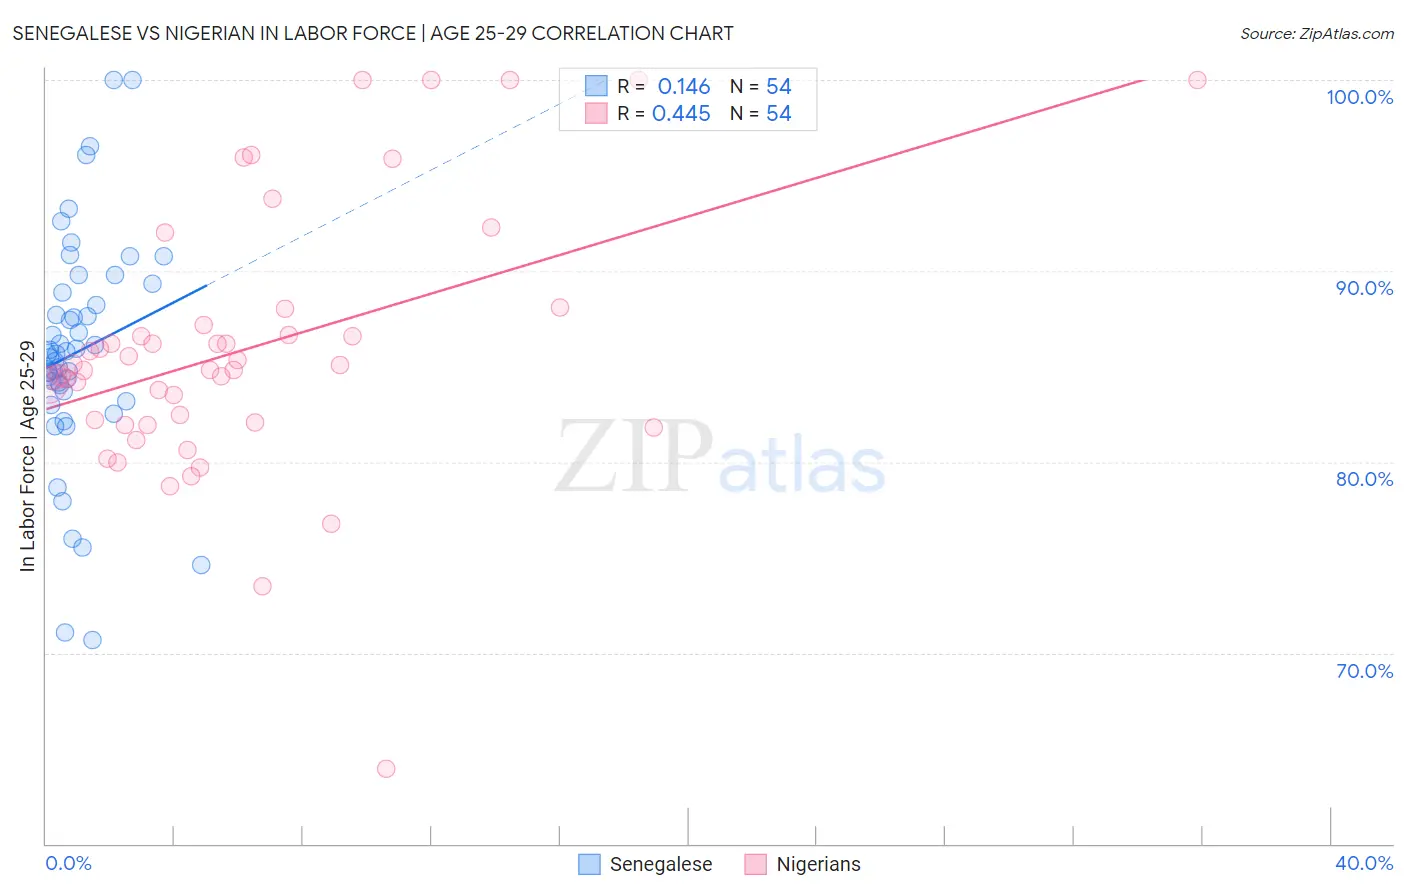
Senegalese vs Nigerian In Labor Force | Age 25-29 Correlation Chart
The statistical analysis conducted on geographies consisting of 78,132,708 people shows a poor positive correlation between the proportion of Senegalese and labor force participation rate among population between the ages 25 and 29 in the United States with a correlation coefficient (R) of 0.146 and weighted average of 85.0%. Similarly, the statistical analysis conducted on geographies consisting of 332,698,985 people shows a moderate positive correlation between the proportion of Nigerians and labor force participation rate among population between the ages 25 and 29 in the United States with a correlation coefficient (R) of 0.445 and weighted average of 84.3%, a difference of 0.90%.
In Labor Force | Age 25-29 Correlation Summary
| Measurement | Senegalese | Nigerian |
| Minimum | 70.7% | 63.9% |
| Maximum | 100.0% | 100.0% |
| Range | 29.3% | 36.1% |
| Mean | 85.8% | 85.9% |
| Median | 85.7% | 85.0% |
| Interquartile 25% (IQ1) | 83.7% | 82.0% |
| Interquartile 75% (IQ3) | 88.9% | 87.1% |
| Interquartile Range (IQR) | 5.2% | 5.1% |
| Standard Deviation (Sample) | 6.0% | 6.9% |
| Standard Deviation (Population) | 5.9% | 6.9% |
Similar Demographics by In Labor Force | Age 25-29
Demographics Similar to Senegalese by In Labor Force | Age 25-29
In terms of in labor force | age 25-29, the demographic groups most similar to Senegalese are New Zealander (85.0%, a difference of 0.010%), Immigrants from Middle Africa (85.0%, a difference of 0.010%), Irish (85.0%, a difference of 0.010%), Immigrants from Malaysia (85.0%, a difference of 0.010%), and Immigrants from Austria (85.0%, a difference of 0.020%).
| Demographics | Rating | Rank | In Labor Force | Age 25-29 |
| Immigrants | Hong Kong | 92.8 /100 | #105 | Exceptional 85.0% |
| Czechoslovakians | 92.6 /100 | #106 | Exceptional 85.0% |
| Immigrants | Southern Europe | 92.3 /100 | #107 | Exceptional 85.0% |
| Immigrants | Austria | 91.9 /100 | #108 | Exceptional 85.0% |
| Costa Ricans | 91.9 /100 | #109 | Exceptional 85.0% |
| New Zealanders | 91.5 /100 | #110 | Exceptional 85.0% |
| Immigrants | Middle Africa | 91.4 /100 | #111 | Exceptional 85.0% |
| Senegalese | 90.9 /100 | #112 | Exceptional 85.0% |
| Irish | 90.6 /100 | #113 | Exceptional 85.0% |
| Immigrants | Malaysia | 90.4 /100 | #114 | Exceptional 85.0% |
| South Africans | 88.9 /100 | #115 | Excellent 85.0% |
| Chileans | 88.8 /100 | #116 | Excellent 85.0% |
| Immigrants | Belarus | 88.0 /100 | #117 | Excellent 85.0% |
| Finns | 87.8 /100 | #118 | Excellent 85.0% |
| Filipinos | 87.1 /100 | #119 | Excellent 84.9% |
Demographics Similar to Nigerians by In Labor Force | Age 25-29
In terms of in labor force | age 25-29, the demographic groups most similar to Nigerians are Arab (84.2%, a difference of 0.010%), Jordanian (84.2%, a difference of 0.010%), Scotch-Irish (84.2%, a difference of 0.020%), Immigrants from Nigeria (84.3%, a difference of 0.040%), and Immigrants from Saudi Arabia (84.3%, a difference of 0.040%).
| Demographics | Rating | Rank | In Labor Force | Age 25-29 |
| Japanese | 11.4 /100 | #213 | Poor 84.3% |
| Lebanese | 11.1 /100 | #214 | Poor 84.3% |
| Immigrants | Syria | 10.7 /100 | #215 | Poor 84.3% |
| Israelis | 9.3 /100 | #216 | Tragic 84.3% |
| Immigrants | Ecuador | 9.3 /100 | #217 | Tragic 84.3% |
| Immigrants | Nigeria | 9.0 /100 | #218 | Tragic 84.3% |
| Immigrants | Saudi Arabia | 8.8 /100 | #219 | Tragic 84.3% |
| Nigerians | 7.2 /100 | #220 | Tragic 84.3% |
| Arabs | 6.8 /100 | #221 | Tragic 84.2% |
| Jordanians | 6.7 /100 | #222 | Tragic 84.2% |
| Scotch-Irish | 6.5 /100 | #223 | Tragic 84.2% |
| Immigrants | West Indies | 6.0 /100 | #224 | Tragic 84.2% |
| Koreans | 5.9 /100 | #225 | Tragic 84.2% |
| Immigrants | Congo | 5.8 /100 | #226 | Tragic 84.2% |
| French American Indians | 5.5 /100 | #227 | Tragic 84.2% |