Senegalese vs Norwegian In Labor Force | Age 25-29
COMPARE
Senegalese
Norwegian
In Labor Force | Age 25-29
In Labor Force | Age 25-29 Comparison
Senegalese
Norwegians
85.0%
IN LABOR FORCE | AGE 25-29
90.9/ 100
METRIC RATING
112th/ 347
METRIC RANK
86.1%
IN LABOR FORCE | AGE 25-29
100.0/ 100
METRIC RATING
13th/ 347
METRIC RANK
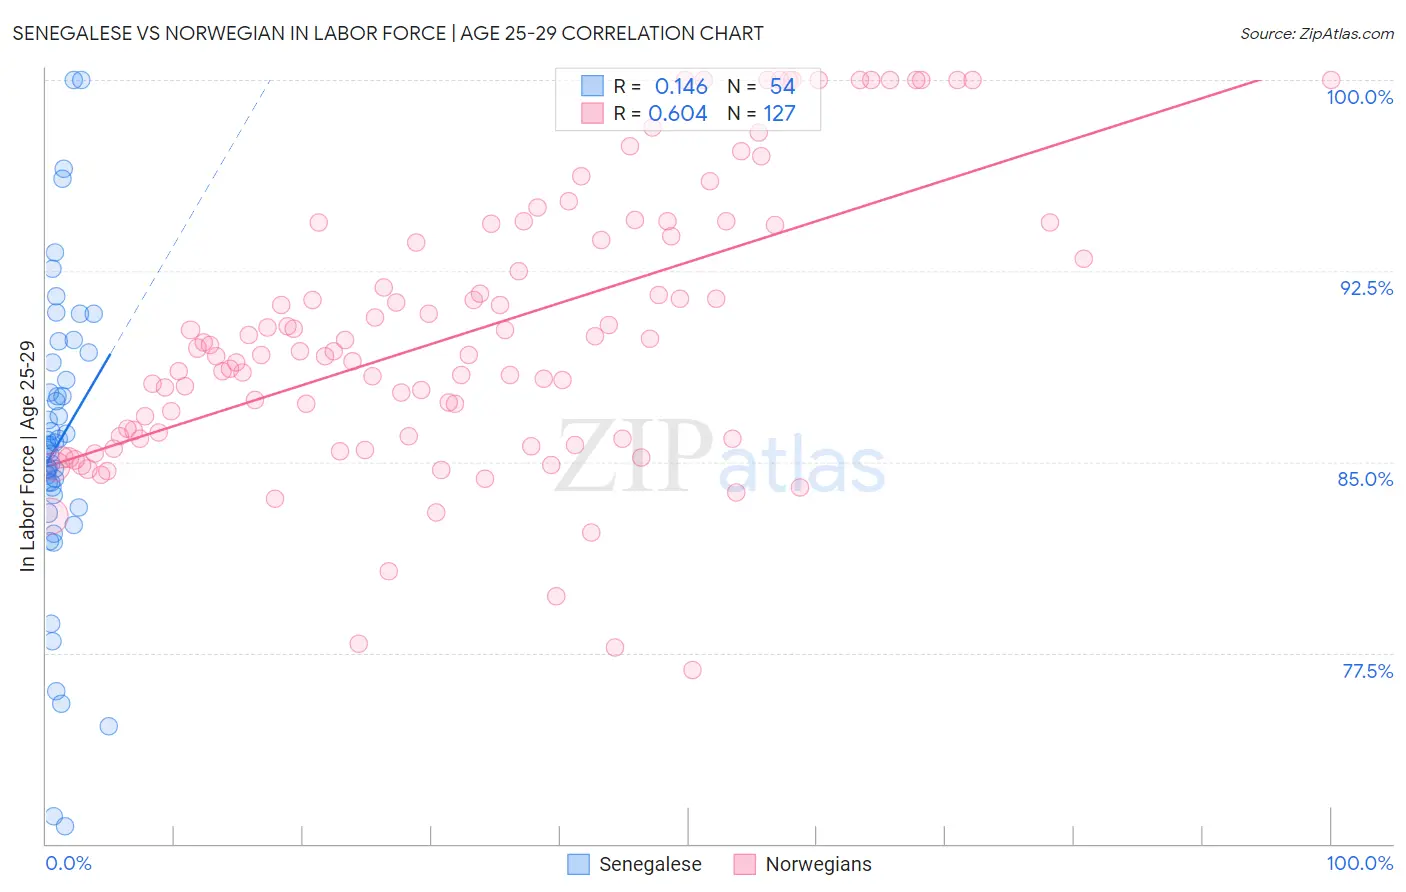
Senegalese vs Norwegian In Labor Force | Age 25-29 Correlation Chart
The statistical analysis conducted on geographies consisting of 78,132,708 people shows a poor positive correlation between the proportion of Senegalese and labor force participation rate among population between the ages 25 and 29 in the United States with a correlation coefficient (R) of 0.146 and weighted average of 85.0%. Similarly, the statistical analysis conducted on geographies consisting of 532,549,963 people shows a significant positive correlation between the proportion of Norwegians and labor force participation rate among population between the ages 25 and 29 in the United States with a correlation coefficient (R) of 0.604 and weighted average of 86.1%, a difference of 1.3%.
In Labor Force | Age 25-29 Correlation Summary
| Measurement | Senegalese | Norwegian |
| Minimum | 70.7% | 76.8% |
| Maximum | 100.0% | 100.0% |
| Range | 29.3% | 23.2% |
| Mean | 85.8% | 90.1% |
| Median | 85.7% | 89.3% |
| Interquartile 25% (IQ1) | 83.7% | 85.9% |
| Interquartile 75% (IQ3) | 88.9% | 94.3% |
| Interquartile Range (IQR) | 5.2% | 8.4% |
| Standard Deviation (Sample) | 6.0% | 5.5% |
| Standard Deviation (Population) | 5.9% | 5.4% |
Similar Demographics by In Labor Force | Age 25-29
Demographics Similar to Senegalese by In Labor Force | Age 25-29
In terms of in labor force | age 25-29, the demographic groups most similar to Senegalese are New Zealander (85.0%, a difference of 0.010%), Immigrants from Middle Africa (85.0%, a difference of 0.010%), Irish (85.0%, a difference of 0.010%), Immigrants from Malaysia (85.0%, a difference of 0.010%), and Immigrants from Austria (85.0%, a difference of 0.020%).
| Demographics | Rating | Rank | In Labor Force | Age 25-29 |
| Immigrants | Hong Kong | 92.8 /100 | #105 | Exceptional 85.0% |
| Czechoslovakians | 92.6 /100 | #106 | Exceptional 85.0% |
| Immigrants | Southern Europe | 92.3 /100 | #107 | Exceptional 85.0% |
| Immigrants | Austria | 91.9 /100 | #108 | Exceptional 85.0% |
| Costa Ricans | 91.9 /100 | #109 | Exceptional 85.0% |
| New Zealanders | 91.5 /100 | #110 | Exceptional 85.0% |
| Immigrants | Middle Africa | 91.4 /100 | #111 | Exceptional 85.0% |
| Senegalese | 90.9 /100 | #112 | Exceptional 85.0% |
| Irish | 90.6 /100 | #113 | Exceptional 85.0% |
| Immigrants | Malaysia | 90.4 /100 | #114 | Exceptional 85.0% |
| South Africans | 88.9 /100 | #115 | Excellent 85.0% |
| Chileans | 88.8 /100 | #116 | Excellent 85.0% |
| Immigrants | Belarus | 88.0 /100 | #117 | Excellent 85.0% |
| Finns | 87.8 /100 | #118 | Excellent 85.0% |
| Filipinos | 87.1 /100 | #119 | Excellent 84.9% |
Demographics Similar to Norwegians by In Labor Force | Age 25-29
In terms of in labor force | age 25-29, the demographic groups most similar to Norwegians are Immigrants from Lithuania (86.1%, a difference of 0.010%), Immigrants from Ethiopia (86.1%, a difference of 0.020%), Liberian (86.1%, a difference of 0.030%), Latvian (86.1%, a difference of 0.030%), and Bolivian (86.1%, a difference of 0.030%).
| Demographics | Rating | Rank | In Labor Force | Age 25-29 |
| Slovenes | 100.0 /100 | #6 | Exceptional 86.4% |
| Immigrants | Bosnia and Herzegovina | 100.0 /100 | #7 | Exceptional 86.3% |
| Immigrants | Cabo Verde | 100.0 /100 | #8 | Exceptional 86.2% |
| Ethiopians | 100.0 /100 | #9 | Exceptional 86.2% |
| Liberians | 100.0 /100 | #10 | Exceptional 86.1% |
| Immigrants | Ethiopia | 100.0 /100 | #11 | Exceptional 86.1% |
| Immigrants | Lithuania | 100.0 /100 | #12 | Exceptional 86.1% |
| Norwegians | 100.0 /100 | #13 | Exceptional 86.1% |
| Latvians | 100.0 /100 | #14 | Exceptional 86.1% |
| Bolivians | 100.0 /100 | #15 | Exceptional 86.1% |
| Immigrants | Bolivia | 100.0 /100 | #16 | Exceptional 86.1% |
| Bermudans | 100.0 /100 | #17 | Exceptional 86.0% |
| Bulgarians | 100.0 /100 | #18 | Exceptional 86.0% |
| Cape Verdeans | 100.0 /100 | #19 | Exceptional 86.0% |
| Immigrants | Ireland | 100.0 /100 | #20 | Exceptional 86.0% |