Senegalese vs Afghan Householder Income Ages 25 - 44 years
COMPARE
Senegalese
Afghan
Householder Income Ages 25 - 44 years
Householder Income Ages 25 - 44 years Comparison
Senegalese
Afghans
$82,852
HOUSEHOLDER INCOME AGES 25 - 44 YEARS
0.2/ 100
METRIC RATING
278th/ 347
METRIC RANK
$104,410
HOUSEHOLDER INCOME AGES 25 - 44 YEARS
99.6/ 100
METRIC RATING
71st/ 347
METRIC RANK
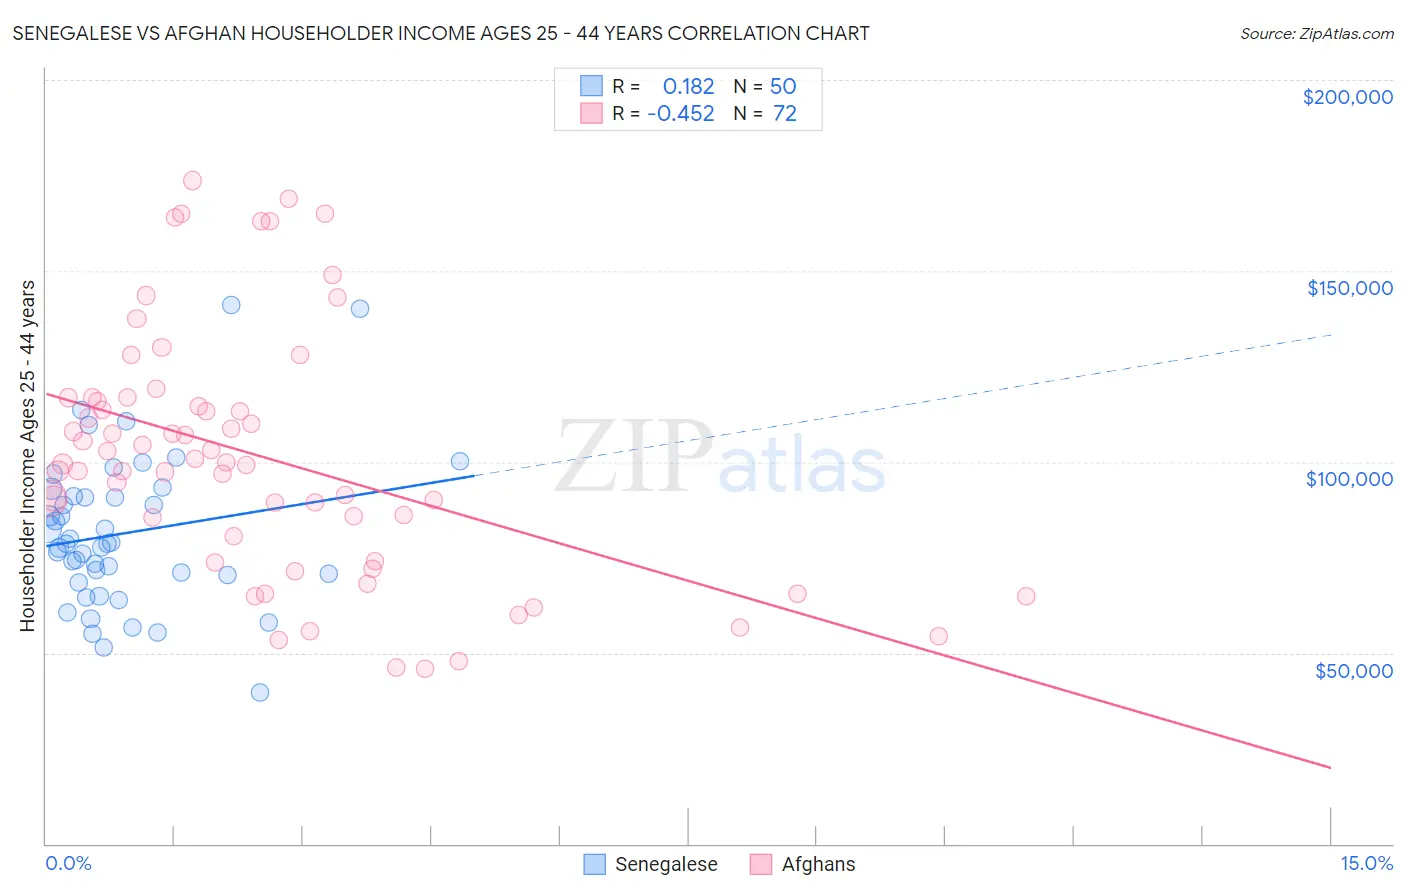
Senegalese vs Afghan Householder Income Ages 25 - 44 years Correlation Chart
The statistical analysis conducted on geographies consisting of 78,048,769 people shows a poor positive correlation between the proportion of Senegalese and household income with householder between the ages 25 and 44 in the United States with a correlation coefficient (R) of 0.182 and weighted average of $82,852. Similarly, the statistical analysis conducted on geographies consisting of 148,765,524 people shows a moderate negative correlation between the proportion of Afghans and household income with householder between the ages 25 and 44 in the United States with a correlation coefficient (R) of -0.452 and weighted average of $104,410, a difference of 26.0%.
Householder Income Ages 25 - 44 years Correlation Summary
| Measurement | Senegalese | Afghan |
| Minimum | $39,688 | $45,809 |
| Maximum | $141,023 | $173,653 |
| Range | $101,335 | $127,844 |
| Mean | $81,327 | $101,372 |
| Median | $78,521 | $99,588 |
| Interquartile 25% (IQ1) | $70,437 | $77,205 |
| Interquartile 75% (IQ3) | $90,994 | $116,400 |
| Interquartile Range (IQR) | $20,557 | $39,195 |
| Standard Deviation (Sample) | $20,178 | $32,218 |
| Standard Deviation (Population) | $19,975 | $31,993 |
Similar Demographics by Householder Income Ages 25 - 44 years
Demographics Similar to Senegalese by Householder Income Ages 25 - 44 years
In terms of householder income ages 25 - 44 years, the demographic groups most similar to Senegalese are Pima ($82,821, a difference of 0.040%), Paiute ($82,984, a difference of 0.16%), Colville ($82,604, a difference of 0.30%), Immigrants from Belize ($83,141, a difference of 0.35%), and Immigrants from Jamaica ($83,298, a difference of 0.54%).
| Demographics | Rating | Rank | Householder Income Ages 25 - 44 years |
| Somalis | 0.2 /100 | #271 | Tragic $83,752 |
| Spanish Americans | 0.2 /100 | #272 | Tragic $83,722 |
| Iroquois | 0.2 /100 | #273 | Tragic $83,682 |
| Marshallese | 0.2 /100 | #274 | Tragic $83,575 |
| Immigrants | Jamaica | 0.2 /100 | #275 | Tragic $83,298 |
| Immigrants | Belize | 0.2 /100 | #276 | Tragic $83,141 |
| Paiute | 0.2 /100 | #277 | Tragic $82,984 |
| Senegalese | 0.2 /100 | #278 | Tragic $82,852 |
| Pima | 0.1 /100 | #279 | Tragic $82,821 |
| Colville | 0.1 /100 | #280 | Tragic $82,604 |
| Cajuns | 0.1 /100 | #281 | Tragic $82,393 |
| Central American Indians | 0.1 /100 | #282 | Tragic $82,355 |
| Guatemalans | 0.1 /100 | #283 | Tragic $82,331 |
| Immigrants | Middle Africa | 0.1 /100 | #284 | Tragic $82,254 |
| Immigrants | Somalia | 0.1 /100 | #285 | Tragic $82,188 |
Demographics Similar to Afghans by Householder Income Ages 25 - 44 years
In terms of householder income ages 25 - 44 years, the demographic groups most similar to Afghans are Immigrants from Croatia ($104,503, a difference of 0.090%), Chinese ($104,264, a difference of 0.14%), Mongolian ($104,578, a difference of 0.16%), Italian ($104,215, a difference of 0.19%), and Immigrants from Eastern Europe ($104,662, a difference of 0.24%).
| Demographics | Rating | Rank | Householder Income Ages 25 - 44 years |
| New Zealanders | 99.7 /100 | #64 | Exceptional $105,085 |
| Immigrants | Netherlands | 99.7 /100 | #65 | Exceptional $105,082 |
| Laotians | 99.7 /100 | #66 | Exceptional $104,993 |
| Immigrants | Romania | 99.6 /100 | #67 | Exceptional $104,713 |
| Immigrants | Eastern Europe | 99.6 /100 | #68 | Exceptional $104,662 |
| Mongolians | 99.6 /100 | #69 | Exceptional $104,578 |
| Immigrants | Croatia | 99.6 /100 | #70 | Exceptional $104,503 |
| Afghans | 99.6 /100 | #71 | Exceptional $104,410 |
| Chinese | 99.5 /100 | #72 | Exceptional $104,264 |
| Italians | 99.5 /100 | #73 | Exceptional $104,215 |
| Immigrants | Fiji | 99.5 /100 | #74 | Exceptional $103,954 |
| Koreans | 99.4 /100 | #75 | Exceptional $103,824 |
| Immigrants | Spain | 99.4 /100 | #76 | Exceptional $103,752 |
| Immigrants | Southern Europe | 99.3 /100 | #77 | Exceptional $103,486 |
| Immigrants | Bulgaria | 99.3 /100 | #78 | Exceptional $103,423 |