Senegalese vs Immigrants from Romania In Labor Force | Age 25-29
COMPARE
Senegalese
Immigrants from Romania
In Labor Force | Age 25-29
In Labor Force | Age 25-29 Comparison
Senegalese
Immigrants from Romania
85.0%
IN LABOR FORCE | AGE 25-29
90.9/ 100
METRIC RATING
112th/ 347
METRIC RANK
85.1%
IN LABOR FORCE | AGE 25-29
94.6/ 100
METRIC RATING
96th/ 347
METRIC RANK
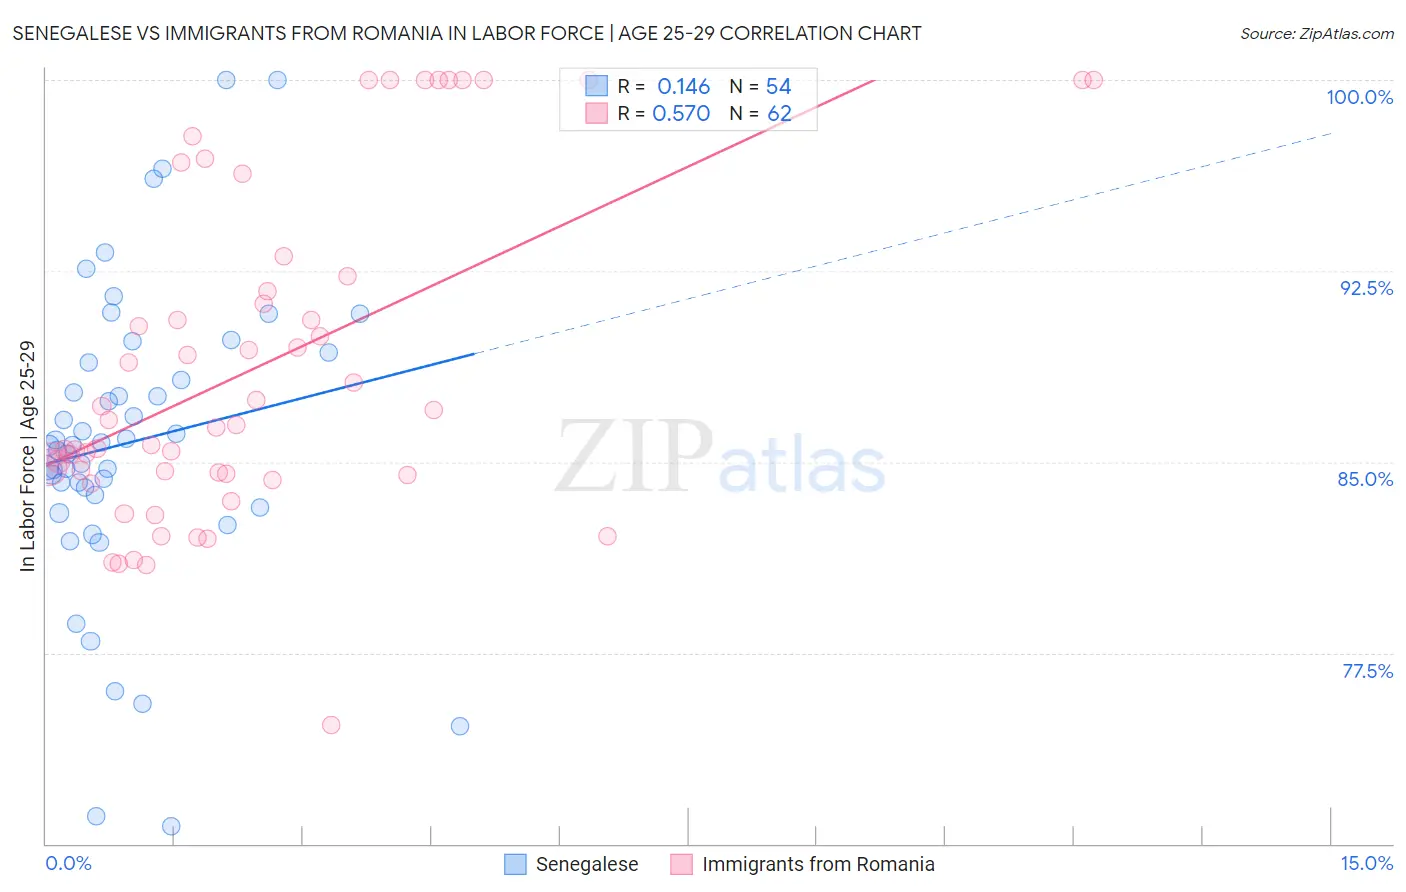
Senegalese vs Immigrants from Romania In Labor Force | Age 25-29 Correlation Chart
The statistical analysis conducted on geographies consisting of 78,132,708 people shows a poor positive correlation between the proportion of Senegalese and labor force participation rate among population between the ages 25 and 29 in the United States with a correlation coefficient (R) of 0.146 and weighted average of 85.0%. Similarly, the statistical analysis conducted on geographies consisting of 256,997,701 people shows a substantial positive correlation between the proportion of Immigrants from Romania and labor force participation rate among population between the ages 25 and 29 in the United States with a correlation coefficient (R) of 0.570 and weighted average of 85.1%, a difference of 0.10%.
In Labor Force | Age 25-29 Correlation Summary
| Measurement | Senegalese | Immigrants from Romania |
| Minimum | 70.7% | 74.7% |
| Maximum | 100.0% | 100.0% |
| Range | 29.3% | 25.3% |
| Mean | 85.8% | 88.8% |
| Median | 85.7% | 86.5% |
| Interquartile 25% (IQ1) | 83.7% | 84.5% |
| Interquartile 75% (IQ3) | 88.9% | 92.3% |
| Interquartile Range (IQR) | 5.2% | 7.8% |
| Standard Deviation (Sample) | 6.0% | 6.5% |
| Standard Deviation (Population) | 5.9% | 6.4% |
Demographics Similar to Senegalese and Immigrants from Romania by In Labor Force | Age 25-29
In terms of in labor force | age 25-29, the demographic groups most similar to Senegalese are New Zealander (85.0%, a difference of 0.010%), Immigrants from Middle Africa (85.0%, a difference of 0.010%), Irish (85.0%, a difference of 0.010%), Immigrants from Malaysia (85.0%, a difference of 0.010%), and Immigrants from Austria (85.0%, a difference of 0.020%). Similarly, the demographic groups most similar to Immigrants from Romania are Immigrants from Netherlands (85.1%, a difference of 0.0%), Immigrants from Korea (85.1%, a difference of 0.010%), Immigrants from Sudan (85.1%, a difference of 0.010%), Mongolian (85.1%, a difference of 0.020%), and Bangladeshi (85.1%, a difference of 0.020%).
| Demographics | Rating | Rank | In Labor Force | Age 25-29 |
| Immigrants | Korea | 94.8 /100 | #94 | Exceptional 85.1% |
| Immigrants | Netherlands | 94.6 /100 | #95 | Exceptional 85.1% |
| Immigrants | Romania | 94.6 /100 | #96 | Exceptional 85.1% |
| Immigrants | Sudan | 94.3 /100 | #97 | Exceptional 85.1% |
| Mongolians | 94.1 /100 | #98 | Exceptional 85.1% |
| Bangladeshis | 94.0 /100 | #99 | Exceptional 85.1% |
| Immigrants | Switzerland | 93.9 /100 | #100 | Exceptional 85.1% |
| Egyptians | 93.8 /100 | #101 | Exceptional 85.1% |
| Slavs | 93.7 /100 | #102 | Exceptional 85.1% |
| Immigrants | Japan | 93.5 /100 | #103 | Exceptional 85.1% |
| Immigrants | Zaire | 93.3 /100 | #104 | Exceptional 85.1% |
| Immigrants | Hong Kong | 92.8 /100 | #105 | Exceptional 85.0% |
| Czechoslovakians | 92.6 /100 | #106 | Exceptional 85.0% |
| Immigrants | Southern Europe | 92.3 /100 | #107 | Exceptional 85.0% |
| Immigrants | Austria | 91.9 /100 | #108 | Exceptional 85.0% |
| Costa Ricans | 91.9 /100 | #109 | Exceptional 85.0% |
| New Zealanders | 91.5 /100 | #110 | Exceptional 85.0% |
| Immigrants | Middle Africa | 91.4 /100 | #111 | Exceptional 85.0% |
| Senegalese | 90.9 /100 | #112 | Exceptional 85.0% |
| Irish | 90.6 /100 | #113 | Exceptional 85.0% |
| Immigrants | Malaysia | 90.4 /100 | #114 | Exceptional 85.0% |