Seminole vs Subsaharan African In Labor Force | Age > 16
COMPARE
Seminole
Subsaharan African
In Labor Force | Age > 16
In Labor Force | Age > 16 Comparison
Seminole
Sub-Saharan Africans
62.0%
IN LABOR FORCE | AGE > 16
0.0/ 100
METRIC RATING
323rd/ 347
METRIC RANK
66.2%
IN LABOR FORCE | AGE > 16
99.7/ 100
METRIC RATING
69th/ 347
METRIC RANK
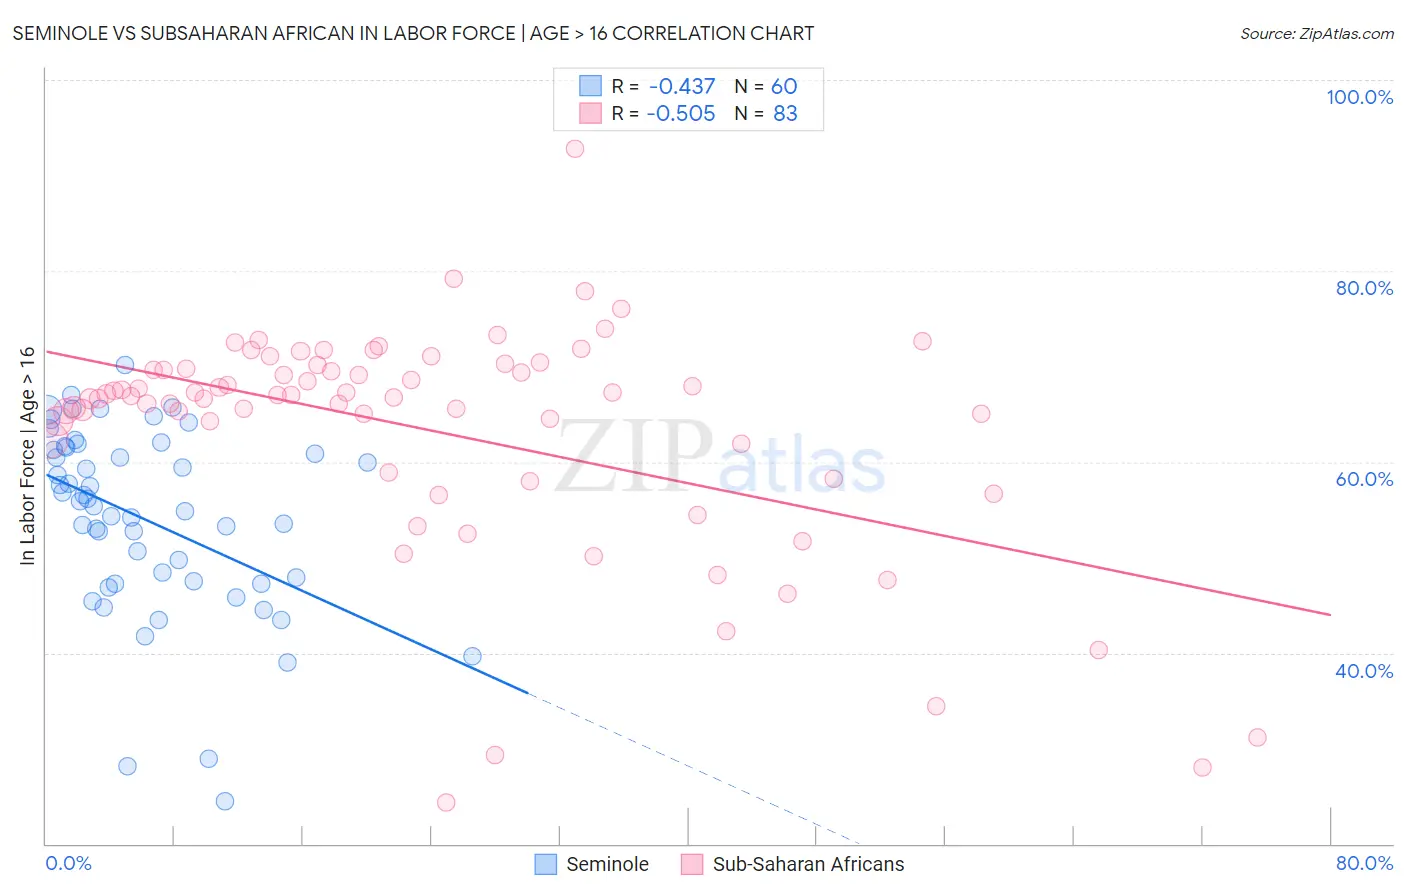
Seminole vs Subsaharan African In Labor Force | Age > 16 Correlation Chart
The statistical analysis conducted on geographies consisting of 118,310,187 people shows a moderate negative correlation between the proportion of Seminole and labor force participation rate among population ages 16 and over in the United States with a correlation coefficient (R) of -0.437 and weighted average of 62.0%. Similarly, the statistical analysis conducted on geographies consisting of 508,218,371 people shows a substantial negative correlation between the proportion of Sub-Saharan Africans and labor force participation rate among population ages 16 and over in the United States with a correlation coefficient (R) of -0.505 and weighted average of 66.2%, a difference of 6.8%.
In Labor Force | Age > 16 Correlation Summary
| Measurement | Seminole | Subsaharan African |
| Minimum | 24.4% | 24.3% |
| Maximum | 70.1% | 92.8% |
| Range | 45.7% | 68.5% |
| Mean | 53.9% | 63.3% |
| Median | 55.6% | 66.9% |
| Interquartile 25% (IQ1) | 47.4% | 58.8% |
| Interquartile 75% (IQ3) | 61.4% | 69.8% |
| Interquartile Range (IQR) | 14.1% | 11.0% |
| Standard Deviation (Sample) | 9.8% | 12.0% |
| Standard Deviation (Population) | 9.7% | 11.9% |
Similar Demographics by In Labor Force | Age > 16
Demographics Similar to Seminole by In Labor Force | Age > 16
In terms of in labor force | age > 16, the demographic groups most similar to Seminole are Ottawa (62.0%, a difference of 0.030%), Cheyenne (62.0%, a difference of 0.040%), Cherokee (61.9%, a difference of 0.090%), American (62.1%, a difference of 0.18%), and Arapaho (62.1%, a difference of 0.22%).
| Demographics | Rating | Rank | In Labor Force | Age > 16 |
| Yup'ik | 0.0 /100 | #316 | Tragic 62.7% |
| Kiowa | 0.0 /100 | #317 | Tragic 62.4% |
| Chickasaw | 0.0 /100 | #318 | Tragic 62.3% |
| Arapaho | 0.0 /100 | #319 | Tragic 62.1% |
| Yakama | 0.0 /100 | #320 | Tragic 62.1% |
| Americans | 0.0 /100 | #321 | Tragic 62.1% |
| Ottawa | 0.0 /100 | #322 | Tragic 62.0% |
| Seminole | 0.0 /100 | #323 | Tragic 62.0% |
| Cheyenne | 0.0 /100 | #324 | Tragic 62.0% |
| Cherokee | 0.0 /100 | #325 | Tragic 61.9% |
| Sioux | 0.0 /100 | #326 | Tragic 61.8% |
| Cajuns | 0.0 /100 | #327 | Tragic 61.8% |
| Dutch West Indians | 0.0 /100 | #328 | Tragic 61.7% |
| Choctaw | 0.0 /100 | #329 | Tragic 61.5% |
| Creek | 0.0 /100 | #330 | Tragic 61.3% |
Demographics Similar to Sub-Saharan Africans by In Labor Force | Age > 16
In terms of in labor force | age > 16, the demographic groups most similar to Sub-Saharan Africans are Immigrants from Egypt (66.2%, a difference of 0.0%), Asian (66.2%, a difference of 0.010%), Burmese (66.2%, a difference of 0.030%), Taiwanese (66.2%, a difference of 0.030%), and Immigrants from Vietnam (66.2%, a difference of 0.040%).
| Demographics | Rating | Rank | In Labor Force | Age > 16 |
| Indonesians | 99.8 /100 | #62 | Exceptional 66.3% |
| Venezuelans | 99.8 /100 | #63 | Exceptional 66.3% |
| Peruvians | 99.8 /100 | #64 | Exceptional 66.3% |
| Sri Lankans | 99.8 /100 | #65 | Exceptional 66.3% |
| Jordanians | 99.8 /100 | #66 | Exceptional 66.3% |
| Egyptians | 99.8 /100 | #67 | Exceptional 66.2% |
| Immigrants | Egypt | 99.7 /100 | #68 | Exceptional 66.2% |
| Sub-Saharan Africans | 99.7 /100 | #69 | Exceptional 66.2% |
| Asians | 99.7 /100 | #70 | Exceptional 66.2% |
| Burmese | 99.7 /100 | #71 | Exceptional 66.2% |
| Taiwanese | 99.7 /100 | #72 | Exceptional 66.2% |
| Immigrants | Vietnam | 99.7 /100 | #73 | Exceptional 66.2% |
| Immigrants | Korea | 99.7 /100 | #74 | Exceptional 66.2% |
| Immigrants | Singapore | 99.7 /100 | #75 | Exceptional 66.2% |
| Immigrants | Malaysia | 99.6 /100 | #76 | Exceptional 66.1% |