Seminole vs Immigrants from Moldova In Labor Force | Age > 16
COMPARE
Seminole
Immigrants from Moldova
In Labor Force | Age > 16
In Labor Force | Age > 16 Comparison
Seminole
Immigrants from Moldova
62.0%
IN LABOR FORCE | AGE > 16
0.0/ 100
METRIC RATING
323rd/ 347
METRIC RANK
66.1%
IN LABOR FORCE | AGE > 16
99.6/ 100
METRIC RATING
77th/ 347
METRIC RANK
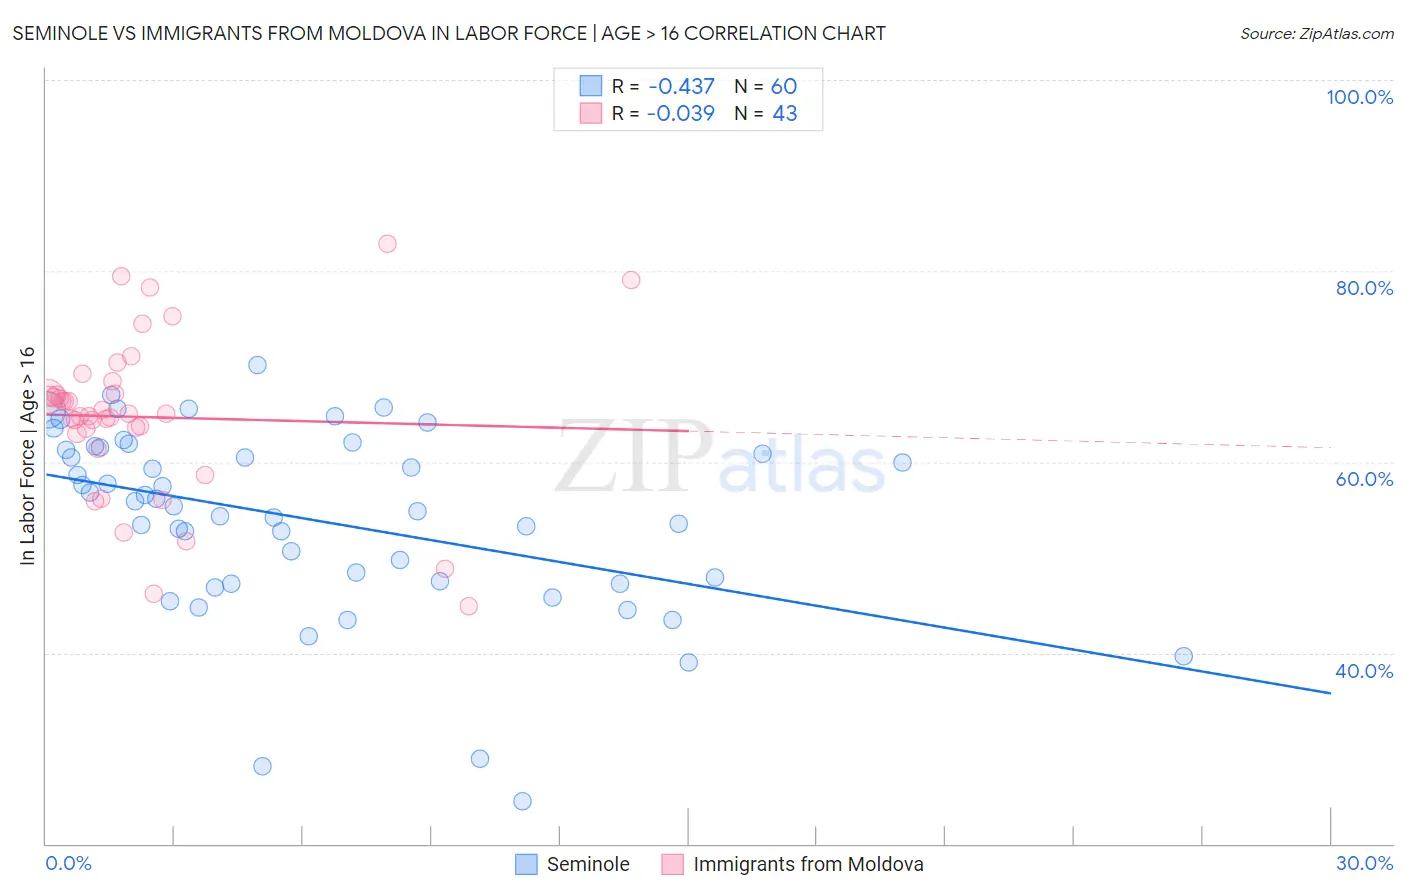
Seminole vs Immigrants from Moldova In Labor Force | Age > 16 Correlation Chart
The statistical analysis conducted on geographies consisting of 118,310,187 people shows a moderate negative correlation between the proportion of Seminole and labor force participation rate among population ages 16 and over in the United States with a correlation coefficient (R) of -0.437 and weighted average of 62.0%. Similarly, the statistical analysis conducted on geographies consisting of 124,396,989 people shows no correlation between the proportion of Immigrants from Moldova and labor force participation rate among population ages 16 and over in the United States with a correlation coefficient (R) of -0.039 and weighted average of 66.1%, a difference of 6.7%.
In Labor Force | Age > 16 Correlation Summary
| Measurement | Seminole | Immigrants from Moldova |
| Minimum | 24.4% | 44.9% |
| Maximum | 70.1% | 82.9% |
| Range | 45.7% | 38.0% |
| Mean | 53.9% | 64.7% |
| Median | 55.6% | 65.1% |
| Interquartile 25% (IQ1) | 47.4% | 62.9% |
| Interquartile 75% (IQ3) | 61.4% | 67.2% |
| Interquartile Range (IQR) | 14.1% | 4.3% |
| Standard Deviation (Sample) | 9.8% | 8.3% |
| Standard Deviation (Population) | 9.7% | 8.2% |
Similar Demographics by In Labor Force | Age > 16
Demographics Similar to Seminole by In Labor Force | Age > 16
In terms of in labor force | age > 16, the demographic groups most similar to Seminole are Ottawa (62.0%, a difference of 0.030%), Cheyenne (62.0%, a difference of 0.040%), Cherokee (61.9%, a difference of 0.090%), American (62.1%, a difference of 0.18%), and Arapaho (62.1%, a difference of 0.22%).
| Demographics | Rating | Rank | In Labor Force | Age > 16 |
| Yup'ik | 0.0 /100 | #316 | Tragic 62.7% |
| Kiowa | 0.0 /100 | #317 | Tragic 62.4% |
| Chickasaw | 0.0 /100 | #318 | Tragic 62.3% |
| Arapaho | 0.0 /100 | #319 | Tragic 62.1% |
| Yakama | 0.0 /100 | #320 | Tragic 62.1% |
| Americans | 0.0 /100 | #321 | Tragic 62.1% |
| Ottawa | 0.0 /100 | #322 | Tragic 62.0% |
| Seminole | 0.0 /100 | #323 | Tragic 62.0% |
| Cheyenne | 0.0 /100 | #324 | Tragic 62.0% |
| Cherokee | 0.0 /100 | #325 | Tragic 61.9% |
| Sioux | 0.0 /100 | #326 | Tragic 61.8% |
| Cajuns | 0.0 /100 | #327 | Tragic 61.8% |
| Dutch West Indians | 0.0 /100 | #328 | Tragic 61.7% |
| Choctaw | 0.0 /100 | #329 | Tragic 61.5% |
| Creek | 0.0 /100 | #330 | Tragic 61.3% |
Demographics Similar to Immigrants from Moldova by In Labor Force | Age > 16
In terms of in labor force | age > 16, the demographic groups most similar to Immigrants from Moldova are Immigrants from Asia (66.1%, a difference of 0.0%), Immigrants from Malaysia (66.1%, a difference of 0.010%), Turkish (66.1%, a difference of 0.030%), Malaysian (66.1%, a difference of 0.040%), and Immigrants from Singapore (66.2%, a difference of 0.060%).
| Demographics | Rating | Rank | In Labor Force | Age > 16 |
| Asians | 99.7 /100 | #70 | Exceptional 66.2% |
| Burmese | 99.7 /100 | #71 | Exceptional 66.2% |
| Taiwanese | 99.7 /100 | #72 | Exceptional 66.2% |
| Immigrants | Vietnam | 99.7 /100 | #73 | Exceptional 66.2% |
| Immigrants | Korea | 99.7 /100 | #74 | Exceptional 66.2% |
| Immigrants | Singapore | 99.7 /100 | #75 | Exceptional 66.2% |
| Immigrants | Malaysia | 99.6 /100 | #76 | Exceptional 66.1% |
| Immigrants | Moldova | 99.6 /100 | #77 | Exceptional 66.1% |
| Immigrants | Asia | 99.6 /100 | #78 | Exceptional 66.1% |
| Turks | 99.6 /100 | #79 | Exceptional 66.1% |
| Malaysians | 99.6 /100 | #80 | Exceptional 66.1% |
| Moroccans | 99.5 /100 | #81 | Exceptional 66.1% |
| German Russians | 99.4 /100 | #82 | Exceptional 66.1% |
| Immigrants | Jordan | 99.4 /100 | #83 | Exceptional 66.1% |
| Central Americans | 99.4 /100 | #84 | Exceptional 66.1% |