Seminole vs Palestinian In Labor Force | Age > 16
COMPARE
Seminole
Palestinian
In Labor Force | Age > 16
In Labor Force | Age > 16 Comparison
Seminole
Palestinians
62.0%
IN LABOR FORCE | AGE > 16
0.0/ 100
METRIC RATING
323rd/ 347
METRIC RANK
65.9%
IN LABOR FORCE | AGE > 16
98.5/ 100
METRIC RATING
104th/ 347
METRIC RANK
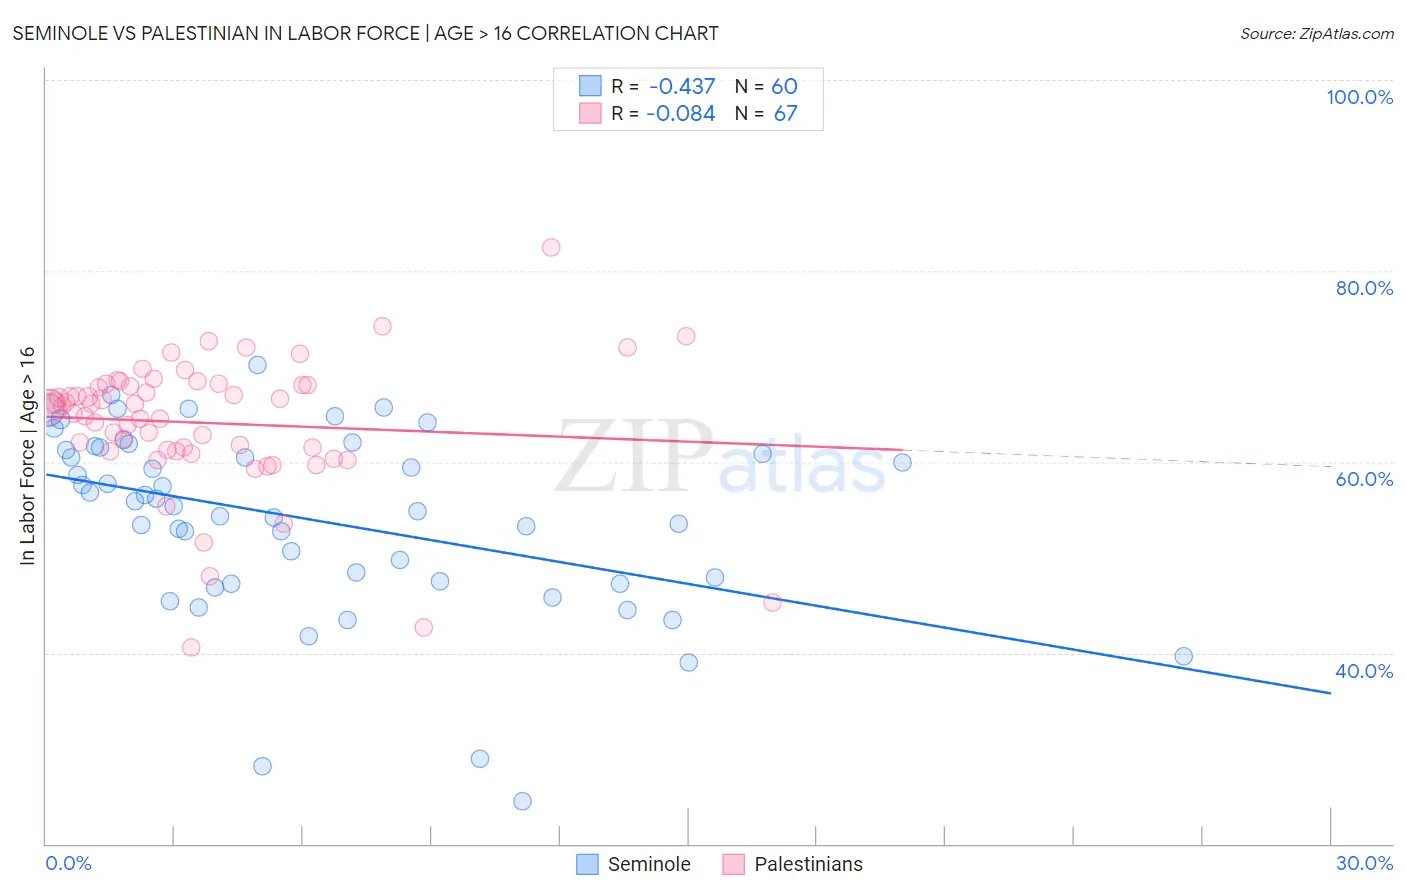
Seminole vs Palestinian In Labor Force | Age > 16 Correlation Chart
The statistical analysis conducted on geographies consisting of 118,310,187 people shows a moderate negative correlation between the proportion of Seminole and labor force participation rate among population ages 16 and over in the United States with a correlation coefficient (R) of -0.437 and weighted average of 62.0%. Similarly, the statistical analysis conducted on geographies consisting of 216,467,324 people shows a slight negative correlation between the proportion of Palestinians and labor force participation rate among population ages 16 and over in the United States with a correlation coefficient (R) of -0.084 and weighted average of 65.9%, a difference of 6.2%.
In Labor Force | Age > 16 Correlation Summary
| Measurement | Seminole | Palestinian |
| Minimum | 24.4% | 40.5% |
| Maximum | 70.1% | 82.5% |
| Range | 45.7% | 42.0% |
| Mean | 53.9% | 64.1% |
| Median | 55.6% | 65.8% |
| Interquartile 25% (IQ1) | 47.4% | 61.2% |
| Interquartile 75% (IQ3) | 61.4% | 68.1% |
| Interquartile Range (IQR) | 14.1% | 6.9% |
| Standard Deviation (Sample) | 9.8% | 7.1% |
| Standard Deviation (Population) | 9.7% | 7.0% |
Similar Demographics by In Labor Force | Age > 16
Demographics Similar to Seminole by In Labor Force | Age > 16
In terms of in labor force | age > 16, the demographic groups most similar to Seminole are Ottawa (62.0%, a difference of 0.030%), Cheyenne (62.0%, a difference of 0.040%), Cherokee (61.9%, a difference of 0.090%), American (62.1%, a difference of 0.18%), and Arapaho (62.1%, a difference of 0.22%).
| Demographics | Rating | Rank | In Labor Force | Age > 16 |
| Yup'ik | 0.0 /100 | #316 | Tragic 62.7% |
| Kiowa | 0.0 /100 | #317 | Tragic 62.4% |
| Chickasaw | 0.0 /100 | #318 | Tragic 62.3% |
| Arapaho | 0.0 /100 | #319 | Tragic 62.1% |
| Yakama | 0.0 /100 | #320 | Tragic 62.1% |
| Americans | 0.0 /100 | #321 | Tragic 62.1% |
| Ottawa | 0.0 /100 | #322 | Tragic 62.0% |
| Seminole | 0.0 /100 | #323 | Tragic 62.0% |
| Cheyenne | 0.0 /100 | #324 | Tragic 62.0% |
| Cherokee | 0.0 /100 | #325 | Tragic 61.9% |
| Sioux | 0.0 /100 | #326 | Tragic 61.8% |
| Cajuns | 0.0 /100 | #327 | Tragic 61.8% |
| Dutch West Indians | 0.0 /100 | #328 | Tragic 61.7% |
| Choctaw | 0.0 /100 | #329 | Tragic 61.5% |
| Creek | 0.0 /100 | #330 | Tragic 61.3% |
Demographics Similar to Palestinians by In Labor Force | Age > 16
In terms of in labor force | age > 16, the demographic groups most similar to Palestinians are Immigrants from South Eastern Asia (65.9%, a difference of 0.010%), Colombian (65.9%, a difference of 0.010%), Immigrants from Colombia (65.9%, a difference of 0.030%), Uruguayan (65.9%, a difference of 0.030%), and Immigrants from Australia (65.9%, a difference of 0.040%).
| Demographics | Rating | Rank | In Labor Force | Age > 16 |
| Filipinos | 98.9 /100 | #97 | Exceptional 65.9% |
| Immigrants | Chile | 98.7 /100 | #98 | Exceptional 65.9% |
| Immigrants | Australia | 98.7 /100 | #99 | Exceptional 65.9% |
| Okinawans | 98.7 /100 | #100 | Exceptional 65.9% |
| Immigrants | Colombia | 98.6 /100 | #101 | Exceptional 65.9% |
| Uruguayans | 98.6 /100 | #102 | Exceptional 65.9% |
| Immigrants | South Eastern Asia | 98.5 /100 | #103 | Exceptional 65.9% |
| Palestinians | 98.5 /100 | #104 | Exceptional 65.9% |
| Colombians | 98.4 /100 | #105 | Exceptional 65.9% |
| Immigrants | Serbia | 98.1 /100 | #106 | Exceptional 65.8% |
| Immigrants | Poland | 98.1 /100 | #107 | Exceptional 65.8% |
| Immigrants | Spain | 98.0 /100 | #108 | Exceptional 65.8% |
| Immigrants | Japan | 98.0 /100 | #109 | Exceptional 65.8% |
| Japanese | 97.7 /100 | #110 | Exceptional 65.8% |
| Immigrants | Honduras | 97.5 /100 | #111 | Exceptional 65.8% |