Immigrants from Moldova vs Subsaharan African In Labor Force | Age > 16
COMPARE
Immigrants from Moldova
Subsaharan African
In Labor Force | Age > 16
In Labor Force | Age > 16 Comparison
Immigrants from Moldova
Sub-Saharan Africans
66.1%
IN LABOR FORCE | AGE > 16
99.6/ 100
METRIC RATING
77th/ 347
METRIC RANK
66.2%
IN LABOR FORCE | AGE > 16
99.7/ 100
METRIC RATING
69th/ 347
METRIC RANK
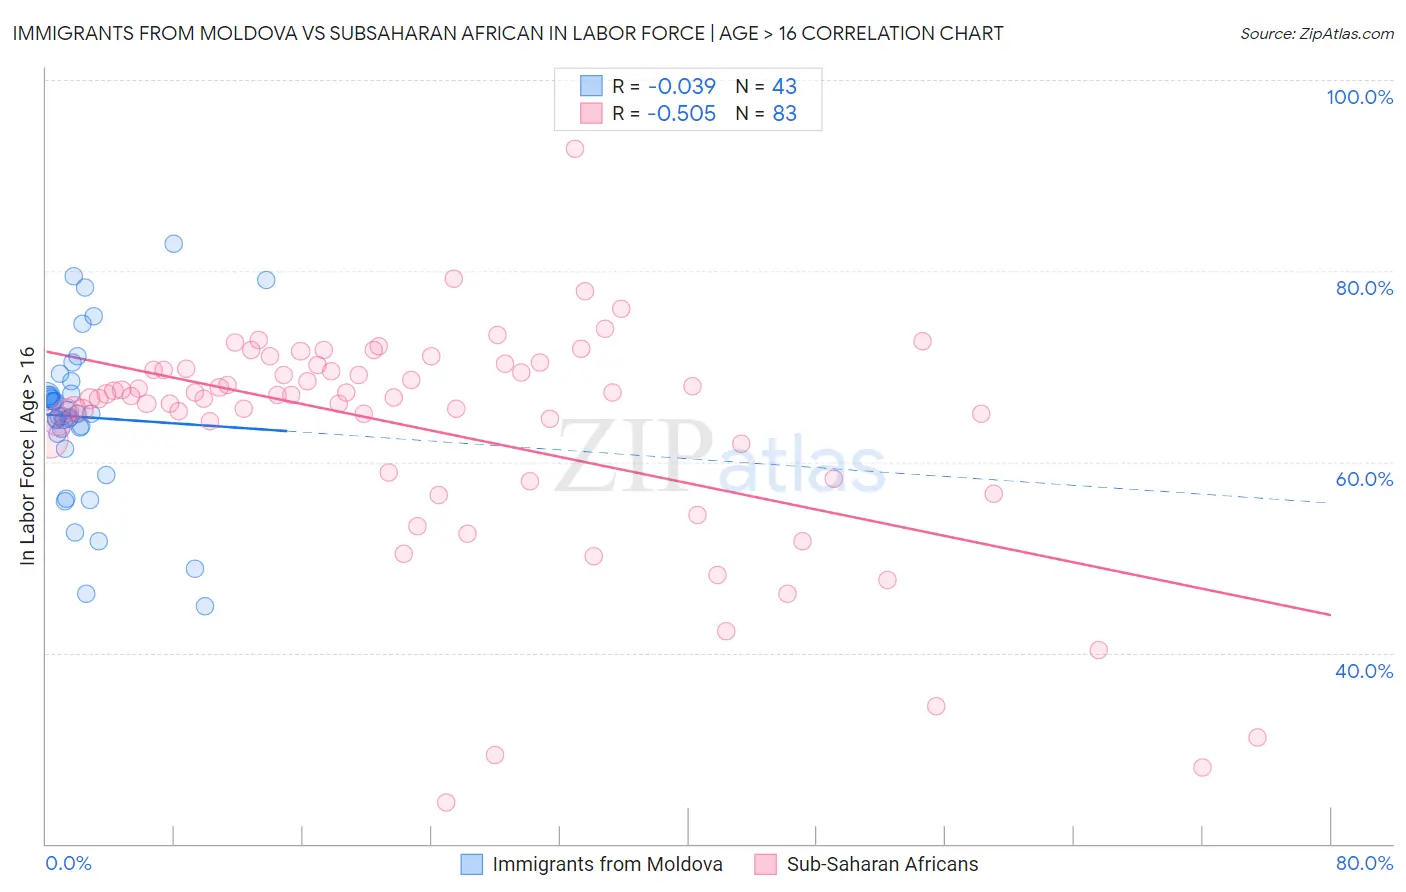
Immigrants from Moldova vs Subsaharan African In Labor Force | Age > 16 Correlation Chart
The statistical analysis conducted on geographies consisting of 124,396,989 people shows no correlation between the proportion of Immigrants from Moldova and labor force participation rate among population ages 16 and over in the United States with a correlation coefficient (R) of -0.039 and weighted average of 66.1%. Similarly, the statistical analysis conducted on geographies consisting of 508,218,371 people shows a substantial negative correlation between the proportion of Sub-Saharan Africans and labor force participation rate among population ages 16 and over in the United States with a correlation coefficient (R) of -0.505 and weighted average of 66.2%, a difference of 0.11%.
In Labor Force | Age > 16 Correlation Summary
| Measurement | Immigrants from Moldova | Subsaharan African |
| Minimum | 44.9% | 24.3% |
| Maximum | 82.9% | 92.8% |
| Range | 38.0% | 68.5% |
| Mean | 64.7% | 63.3% |
| Median | 65.1% | 66.9% |
| Interquartile 25% (IQ1) | 62.9% | 58.8% |
| Interquartile 75% (IQ3) | 67.2% | 69.8% |
| Interquartile Range (IQR) | 4.3% | 11.0% |
| Standard Deviation (Sample) | 8.3% | 12.0% |
| Standard Deviation (Population) | 8.2% | 11.9% |
Demographics Similar to Immigrants from Moldova and Sub-Saharan Africans by In Labor Force | Age > 16
In terms of in labor force | age > 16, the demographic groups most similar to Immigrants from Moldova are Immigrants from Asia (66.1%, a difference of 0.0%), Immigrants from Malaysia (66.1%, a difference of 0.010%), Turkish (66.1%, a difference of 0.030%), Malaysian (66.1%, a difference of 0.040%), and Immigrants from Singapore (66.2%, a difference of 0.060%). Similarly, the demographic groups most similar to Sub-Saharan Africans are Immigrants from Egypt (66.2%, a difference of 0.0%), Asian (66.2%, a difference of 0.010%), Burmese (66.2%, a difference of 0.030%), Taiwanese (66.2%, a difference of 0.030%), and Immigrants from Vietnam (66.2%, a difference of 0.040%).
| Demographics | Rating | Rank | In Labor Force | Age > 16 |
| Venezuelans | 99.8 /100 | #63 | Exceptional 66.3% |
| Peruvians | 99.8 /100 | #64 | Exceptional 66.3% |
| Sri Lankans | 99.8 /100 | #65 | Exceptional 66.3% |
| Jordanians | 99.8 /100 | #66 | Exceptional 66.3% |
| Egyptians | 99.8 /100 | #67 | Exceptional 66.2% |
| Immigrants | Egypt | 99.7 /100 | #68 | Exceptional 66.2% |
| Sub-Saharan Africans | 99.7 /100 | #69 | Exceptional 66.2% |
| Asians | 99.7 /100 | #70 | Exceptional 66.2% |
| Burmese | 99.7 /100 | #71 | Exceptional 66.2% |
| Taiwanese | 99.7 /100 | #72 | Exceptional 66.2% |
| Immigrants | Vietnam | 99.7 /100 | #73 | Exceptional 66.2% |
| Immigrants | Korea | 99.7 /100 | #74 | Exceptional 66.2% |
| Immigrants | Singapore | 99.7 /100 | #75 | Exceptional 66.2% |
| Immigrants | Malaysia | 99.6 /100 | #76 | Exceptional 66.1% |
| Immigrants | Moldova | 99.6 /100 | #77 | Exceptional 66.1% |
| Immigrants | Asia | 99.6 /100 | #78 | Exceptional 66.1% |
| Turks | 99.6 /100 | #79 | Exceptional 66.1% |
| Malaysians | 99.6 /100 | #80 | Exceptional 66.1% |
| Moroccans | 99.5 /100 | #81 | Exceptional 66.1% |
| German Russians | 99.4 /100 | #82 | Exceptional 66.1% |
| Immigrants | Jordan | 99.4 /100 | #83 | Exceptional 66.1% |