Puerto Rican vs Immigrants from Brazil In Labor Force | Age > 16
COMPARE
Puerto Rican
Immigrants from Brazil
In Labor Force | Age > 16
In Labor Force | Age > 16 Comparison
Puerto Ricans
Immigrants from Brazil
58.1%
IN LABOR FORCE | AGE > 16
0.0/ 100
METRIC RATING
342nd/ 347
METRIC RANK
66.7%
IN LABOR FORCE | AGE > 16
100.0/ 100
METRIC RATING
45th/ 347
METRIC RANK
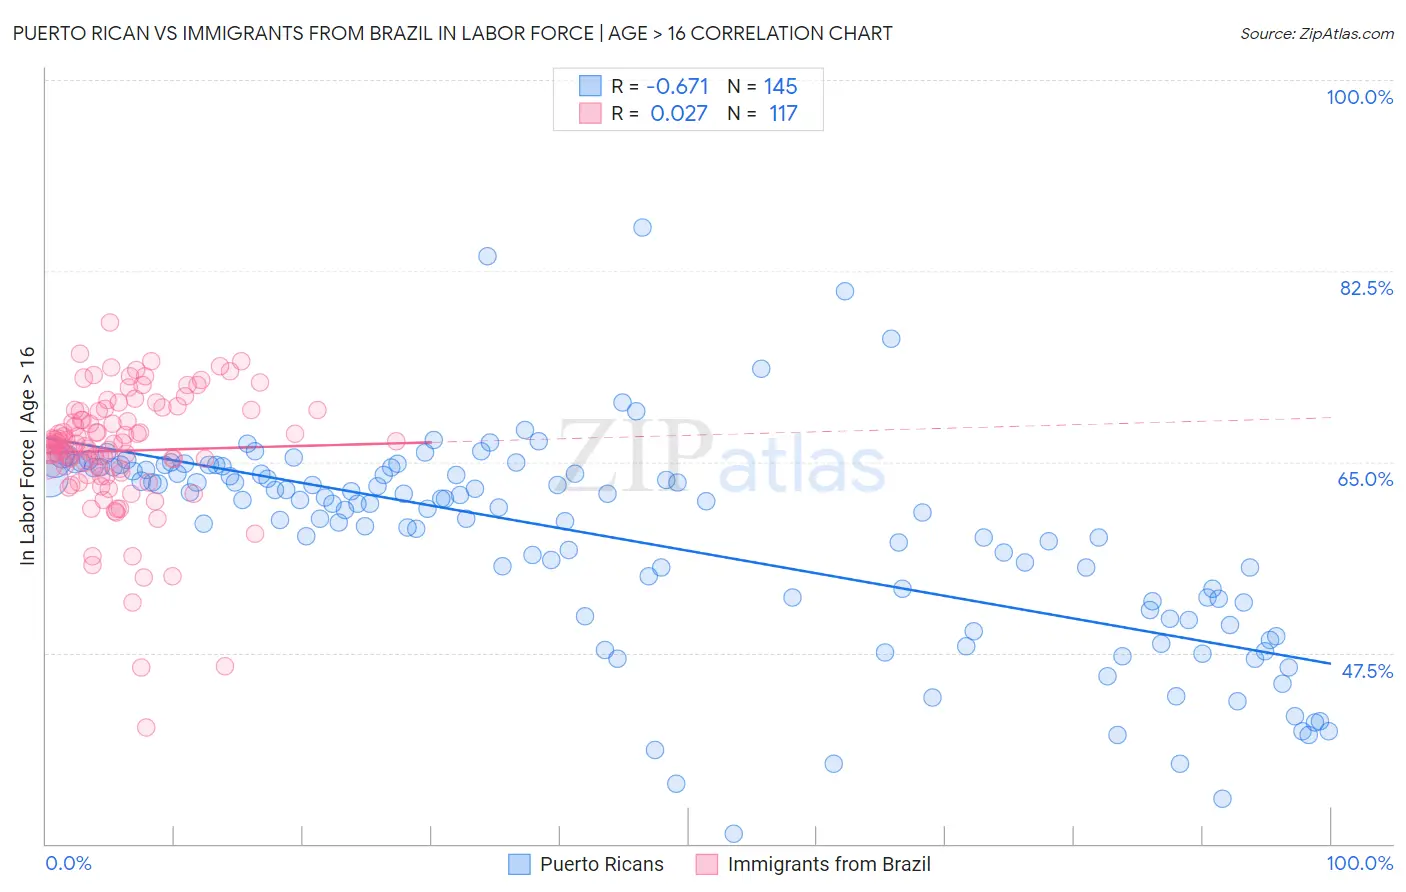
Puerto Rican vs Immigrants from Brazil In Labor Force | Age > 16 Correlation Chart
The statistical analysis conducted on geographies consisting of 528,299,719 people shows a significant negative correlation between the proportion of Puerto Ricans and labor force participation rate among population ages 16 and over in the United States with a correlation coefficient (R) of -0.671 and weighted average of 58.1%. Similarly, the statistical analysis conducted on geographies consisting of 343,023,215 people shows no correlation between the proportion of Immigrants from Brazil and labor force participation rate among population ages 16 and over in the United States with a correlation coefficient (R) of 0.027 and weighted average of 66.7%, a difference of 14.7%.
In Labor Force | Age > 16 Correlation Summary
| Measurement | Puerto Rican | Immigrants from Brazil |
| Minimum | 30.9% | 40.7% |
| Maximum | 86.5% | 77.8% |
| Range | 55.6% | 37.1% |
| Mean | 58.0% | 66.0% |
| Median | 61.1% | 66.6% |
| Interquartile 25% (IQ1) | 51.7% | 63.9% |
| Interquartile 75% (IQ3) | 64.5% | 69.7% |
| Interquartile Range (IQR) | 12.8% | 5.8% |
| Standard Deviation (Sample) | 9.7% | 5.8% |
| Standard Deviation (Population) | 9.6% | 5.8% |
Similar Demographics by In Labor Force | Age > 16
Demographics Similar to Puerto Ricans by In Labor Force | Age > 16
In terms of in labor force | age > 16, the demographic groups most similar to Puerto Ricans are Hopi (58.4%, a difference of 0.47%), Yuman (57.8%, a difference of 0.52%), Pima (57.4%, a difference of 1.2%), Tohono O'odham (57.2%, a difference of 1.5%), and Pueblo (59.3%, a difference of 2.0%).
| Demographics | Rating | Rank | In Labor Force | Age > 16 |
| Paiute | 0.0 /100 | #333 | Tragic 60.7% |
| Apache | 0.0 /100 | #334 | Tragic 60.7% |
| Natives/Alaskans | 0.0 /100 | #335 | Tragic 60.6% |
| Menominee | 0.0 /100 | #336 | Tragic 60.6% |
| Colville | 0.0 /100 | #337 | Tragic 59.8% |
| Immigrants | Yemen | 0.0 /100 | #338 | Tragic 59.6% |
| Houma | 0.0 /100 | #339 | Tragic 59.5% |
| Pueblo | 0.0 /100 | #340 | Tragic 59.3% |
| Hopi | 0.0 /100 | #341 | Tragic 58.4% |
| Puerto Ricans | 0.0 /100 | #342 | Tragic 58.1% |
| Yuman | 0.0 /100 | #343 | Tragic 57.8% |
| Pima | 0.0 /100 | #344 | Tragic 57.4% |
| Tohono O'odham | 0.0 /100 | #345 | Tragic 57.2% |
| Lumbee | 0.0 /100 | #346 | Tragic 56.8% |
| Navajo | 0.0 /100 | #347 | Tragic 56.6% |
Demographics Similar to Immigrants from Brazil by In Labor Force | Age > 16
In terms of in labor force | age > 16, the demographic groups most similar to Immigrants from Brazil are Immigrants from Pakistan (66.7%, a difference of 0.050%), Brazilian (66.6%, a difference of 0.070%), Immigrants from Bulgaria (66.6%, a difference of 0.070%), Nigerian (66.6%, a difference of 0.080%), and Luxembourger (66.7%, a difference of 0.10%).
| Demographics | Rating | Rank | In Labor Force | Age > 16 |
| Immigrants | Nigeria | 100.0 /100 | #38 | Exceptional 66.9% |
| Salvadorans | 100.0 /100 | #39 | Exceptional 66.8% |
| Immigrants | El Salvador | 100.0 /100 | #40 | Exceptional 66.8% |
| Immigrants | Zimbabwe | 100.0 /100 | #41 | Exceptional 66.8% |
| Senegalese | 100.0 /100 | #42 | Exceptional 66.7% |
| Luxembourgers | 100.0 /100 | #43 | Exceptional 66.7% |
| Immigrants | Pakistan | 100.0 /100 | #44 | Exceptional 66.7% |
| Immigrants | Brazil | 100.0 /100 | #45 | Exceptional 66.7% |
| Brazilians | 100.0 /100 | #46 | Exceptional 66.6% |
| Immigrants | Bulgaria | 100.0 /100 | #47 | Exceptional 66.6% |
| Nigerians | 100.0 /100 | #48 | Exceptional 66.6% |
| Immigrants | Northern Africa | 100.0 /100 | #49 | Exceptional 66.6% |
| Cape Verdeans | 100.0 /100 | #50 | Exceptional 66.6% |
| Immigrants | Kuwait | 100.0 /100 | #51 | Exceptional 66.5% |
| Paraguayans | 99.9 /100 | #52 | Exceptional 66.5% |