Puerto Rican vs Immigrants from Burma/Myanmar In Labor Force | Age > 16
COMPARE
Puerto Rican
Immigrants from Burma/Myanmar
In Labor Force | Age > 16
In Labor Force | Age > 16 Comparison
Puerto Ricans
Immigrants from Burma/Myanmar
58.1%
IN LABOR FORCE | AGE > 16
0.0/ 100
METRIC RATING
342nd/ 347
METRIC RANK
66.3%
IN LABOR FORCE | AGE > 16
99.8/ 100
METRIC RATING
61st/ 347
METRIC RANK
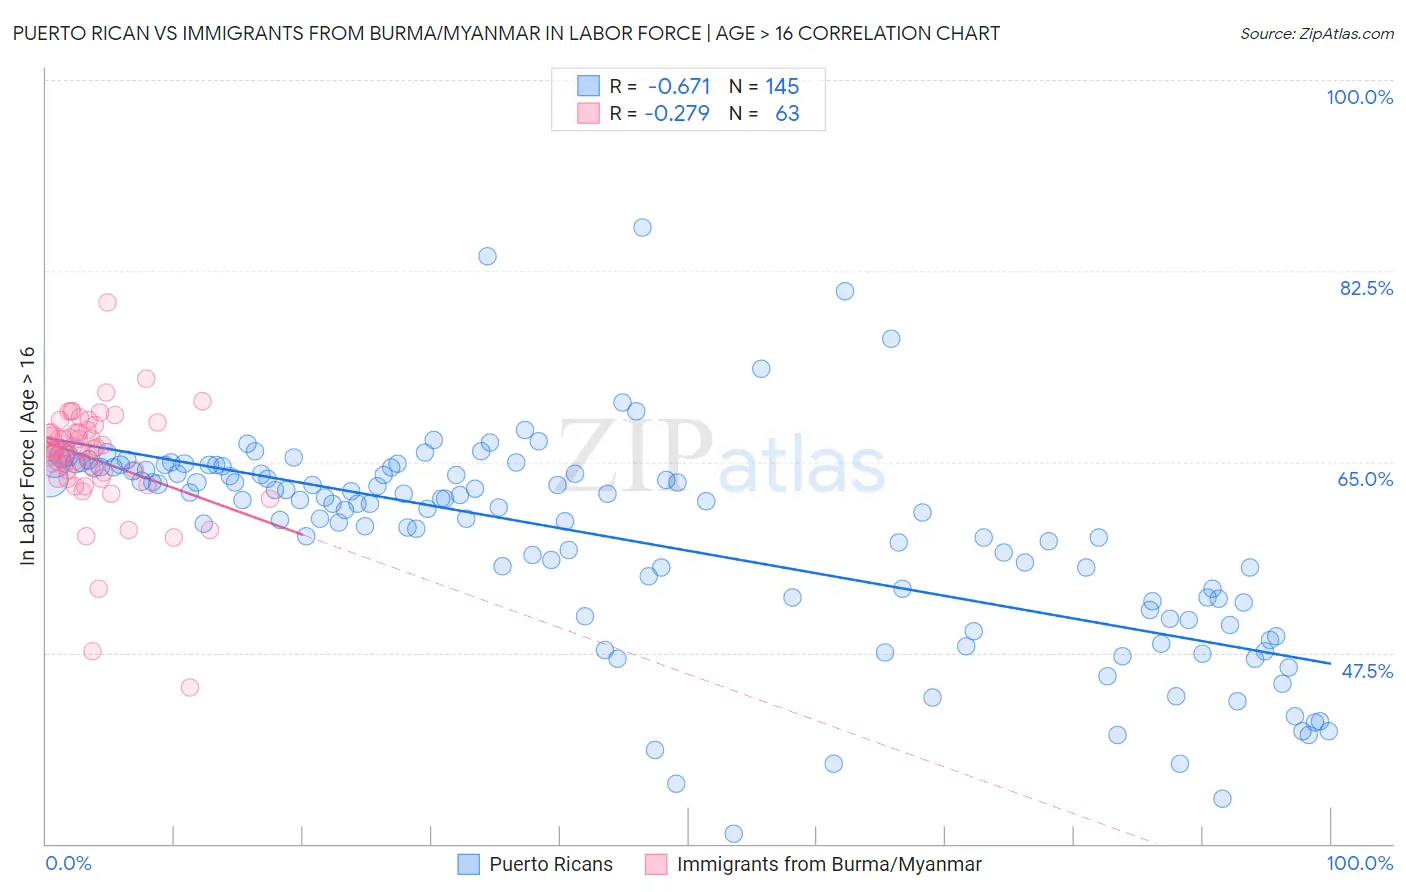
Puerto Rican vs Immigrants from Burma/Myanmar In Labor Force | Age > 16 Correlation Chart
The statistical analysis conducted on geographies consisting of 528,299,719 people shows a significant negative correlation between the proportion of Puerto Ricans and labor force participation rate among population ages 16 and over in the United States with a correlation coefficient (R) of -0.671 and weighted average of 58.1%. Similarly, the statistical analysis conducted on geographies consisting of 172,361,065 people shows a weak negative correlation between the proportion of Immigrants from Burma/Myanmar and labor force participation rate among population ages 16 and over in the United States with a correlation coefficient (R) of -0.279 and weighted average of 66.3%, a difference of 14.1%.
In Labor Force | Age > 16 Correlation Summary
| Measurement | Puerto Rican | Immigrants from Burma/Myanmar |
| Minimum | 30.9% | 44.3% |
| Maximum | 86.5% | 79.6% |
| Range | 55.6% | 35.3% |
| Mean | 58.0% | 65.3% |
| Median | 61.1% | 66.2% |
| Interquartile 25% (IQ1) | 51.7% | 63.5% |
| Interquartile 75% (IQ3) | 64.5% | 67.7% |
| Interquartile Range (IQR) | 12.8% | 4.2% |
| Standard Deviation (Sample) | 9.7% | 5.2% |
| Standard Deviation (Population) | 9.6% | 5.2% |
Similar Demographics by In Labor Force | Age > 16
Demographics Similar to Puerto Ricans by In Labor Force | Age > 16
In terms of in labor force | age > 16, the demographic groups most similar to Puerto Ricans are Hopi (58.4%, a difference of 0.47%), Yuman (57.8%, a difference of 0.52%), Pima (57.4%, a difference of 1.2%), Tohono O'odham (57.2%, a difference of 1.5%), and Pueblo (59.3%, a difference of 2.0%).
| Demographics | Rating | Rank | In Labor Force | Age > 16 |
| Paiute | 0.0 /100 | #333 | Tragic 60.7% |
| Apache | 0.0 /100 | #334 | Tragic 60.7% |
| Natives/Alaskans | 0.0 /100 | #335 | Tragic 60.6% |
| Menominee | 0.0 /100 | #336 | Tragic 60.6% |
| Colville | 0.0 /100 | #337 | Tragic 59.8% |
| Immigrants | Yemen | 0.0 /100 | #338 | Tragic 59.6% |
| Houma | 0.0 /100 | #339 | Tragic 59.5% |
| Pueblo | 0.0 /100 | #340 | Tragic 59.3% |
| Hopi | 0.0 /100 | #341 | Tragic 58.4% |
| Puerto Ricans | 0.0 /100 | #342 | Tragic 58.1% |
| Yuman | 0.0 /100 | #343 | Tragic 57.8% |
| Pima | 0.0 /100 | #344 | Tragic 57.4% |
| Tohono O'odham | 0.0 /100 | #345 | Tragic 57.2% |
| Lumbee | 0.0 /100 | #346 | Tragic 56.8% |
| Navajo | 0.0 /100 | #347 | Tragic 56.6% |
Demographics Similar to Immigrants from Burma/Myanmar by In Labor Force | Age > 16
In terms of in labor force | age > 16, the demographic groups most similar to Immigrants from Burma/Myanmar are Immigrants from Peru (66.3%, a difference of 0.0%), Indonesian (66.3%, a difference of 0.0%), Immigrants from Turkey (66.3%, a difference of 0.030%), Venezuelan (66.3%, a difference of 0.040%), and Peruvian (66.3%, a difference of 0.040%).
| Demographics | Rating | Rank | In Labor Force | Age > 16 |
| Immigrants | Bosnia and Herzegovina | 99.9 /100 | #54 | Exceptional 66.5% |
| Immigrants | Venezuela | 99.9 /100 | #55 | Exceptional 66.4% |
| Immigrants | Senegal | 99.9 /100 | #56 | Exceptional 66.4% |
| Bulgarians | 99.9 /100 | #57 | Exceptional 66.4% |
| Immigrants | Saudi Arabia | 99.9 /100 | #58 | Exceptional 66.3% |
| Immigrants | Turkey | 99.9 /100 | #59 | Exceptional 66.3% |
| Immigrants | Peru | 99.8 /100 | #60 | Exceptional 66.3% |
| Immigrants | Burma/Myanmar | 99.8 /100 | #61 | Exceptional 66.3% |
| Indonesians | 99.8 /100 | #62 | Exceptional 66.3% |
| Venezuelans | 99.8 /100 | #63 | Exceptional 66.3% |
| Peruvians | 99.8 /100 | #64 | Exceptional 66.3% |
| Sri Lankans | 99.8 /100 | #65 | Exceptional 66.3% |
| Jordanians | 99.8 /100 | #66 | Exceptional 66.3% |
| Egyptians | 99.8 /100 | #67 | Exceptional 66.2% |
| Immigrants | Egypt | 99.7 /100 | #68 | Exceptional 66.2% |