Puerto Rican vs Immigrants from Southern Europe In Labor Force | Age > 16
COMPARE
Puerto Rican
Immigrants from Southern Europe
In Labor Force | Age > 16
In Labor Force | Age > 16 Comparison
Puerto Ricans
Immigrants from Southern Europe
58.1%
IN LABOR FORCE | AGE > 16
0.0/ 100
METRIC RATING
342nd/ 347
METRIC RANK
65.0%
IN LABOR FORCE | AGE > 16
31.3/ 100
METRIC RATING
194th/ 347
METRIC RANK
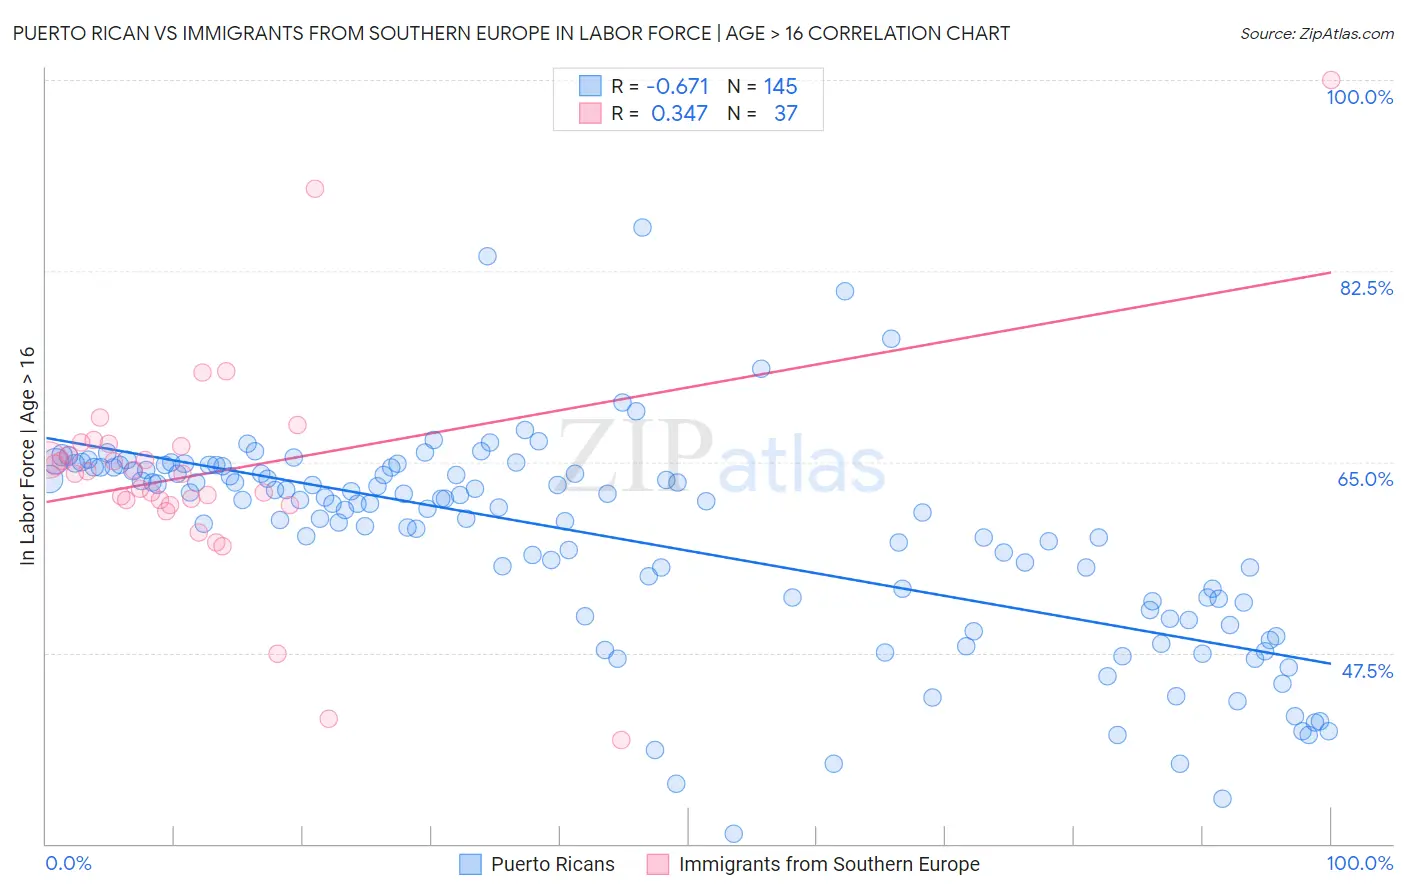
Puerto Rican vs Immigrants from Southern Europe In Labor Force | Age > 16 Correlation Chart
The statistical analysis conducted on geographies consisting of 528,299,719 people shows a significant negative correlation between the proportion of Puerto Ricans and labor force participation rate among population ages 16 and over in the United States with a correlation coefficient (R) of -0.671 and weighted average of 58.1%. Similarly, the statistical analysis conducted on geographies consisting of 402,799,344 people shows a mild positive correlation between the proportion of Immigrants from Southern Europe and labor force participation rate among population ages 16 and over in the United States with a correlation coefficient (R) of 0.347 and weighted average of 65.0%, a difference of 11.8%.
In Labor Force | Age > 16 Correlation Summary
| Measurement | Puerto Rican | Immigrants from Southern Europe |
| Minimum | 30.9% | 39.5% |
| Maximum | 86.5% | 100.0% |
| Range | 55.6% | 60.5% |
| Mean | 58.0% | 64.0% |
| Median | 61.1% | 63.9% |
| Interquartile 25% (IQ1) | 51.7% | 61.3% |
| Interquartile 75% (IQ3) | 64.5% | 66.6% |
| Interquartile Range (IQR) | 12.8% | 5.2% |
| Standard Deviation (Sample) | 9.7% | 10.3% |
| Standard Deviation (Population) | 9.6% | 10.1% |
Similar Demographics by In Labor Force | Age > 16
Demographics Similar to Puerto Ricans by In Labor Force | Age > 16
In terms of in labor force | age > 16, the demographic groups most similar to Puerto Ricans are Hopi (58.4%, a difference of 0.47%), Yuman (57.8%, a difference of 0.52%), Pima (57.4%, a difference of 1.2%), Tohono O'odham (57.2%, a difference of 1.5%), and Pueblo (59.3%, a difference of 2.0%).
| Demographics | Rating | Rank | In Labor Force | Age > 16 |
| Paiute | 0.0 /100 | #333 | Tragic 60.7% |
| Apache | 0.0 /100 | #334 | Tragic 60.7% |
| Natives/Alaskans | 0.0 /100 | #335 | Tragic 60.6% |
| Menominee | 0.0 /100 | #336 | Tragic 60.6% |
| Colville | 0.0 /100 | #337 | Tragic 59.8% |
| Immigrants | Yemen | 0.0 /100 | #338 | Tragic 59.6% |
| Houma | 0.0 /100 | #339 | Tragic 59.5% |
| Pueblo | 0.0 /100 | #340 | Tragic 59.3% |
| Hopi | 0.0 /100 | #341 | Tragic 58.4% |
| Puerto Ricans | 0.0 /100 | #342 | Tragic 58.1% |
| Yuman | 0.0 /100 | #343 | Tragic 57.8% |
| Pima | 0.0 /100 | #344 | Tragic 57.4% |
| Tohono O'odham | 0.0 /100 | #345 | Tragic 57.2% |
| Lumbee | 0.0 /100 | #346 | Tragic 56.8% |
| Navajo | 0.0 /100 | #347 | Tragic 56.6% |
Demographics Similar to Immigrants from Southern Europe by In Labor Force | Age > 16
In terms of in labor force | age > 16, the demographic groups most similar to Immigrants from Southern Europe are Romanian (65.0%, a difference of 0.0%), Haitian (65.0%, a difference of 0.010%), Barbadian (65.0%, a difference of 0.030%), Scandinavian (65.0%, a difference of 0.030%), and Immigrants from Fiji (65.0%, a difference of 0.030%).
| Demographics | Rating | Rank | In Labor Force | Age > 16 |
| Immigrants | Croatia | 35.7 /100 | #187 | Fair 65.0% |
| Immigrants | Portugal | 34.8 /100 | #188 | Fair 65.0% |
| Immigrants | Greece | 34.3 /100 | #189 | Fair 65.0% |
| Barbadians | 33.9 /100 | #190 | Fair 65.0% |
| Scandinavians | 33.7 /100 | #191 | Fair 65.0% |
| Immigrants | Fiji | 33.7 /100 | #192 | Fair 65.0% |
| Immigrants | Europe | 33.6 /100 | #193 | Fair 65.0% |
| Immigrants | Southern Europe | 31.3 /100 | #194 | Fair 65.0% |
| Romanians | 31.1 /100 | #195 | Fair 65.0% |
| Haitians | 30.6 /100 | #196 | Fair 65.0% |
| Immigrants | Italy | 28.7 /100 | #197 | Fair 65.0% |
| Greeks | 26.1 /100 | #198 | Fair 64.9% |
| Mexican American Indians | 23.1 /100 | #199 | Fair 64.9% |
| Armenians | 20.2 /100 | #200 | Fair 64.9% |
| Ukrainians | 19.6 /100 | #201 | Poor 64.9% |