Puerto Rican vs Immigrants from Congo In Labor Force | Age 30-34
COMPARE
Puerto Rican
Immigrants from Congo
In Labor Force | Age 30-34
In Labor Force | Age 30-34 Comparison
Puerto Ricans
Immigrants from Congo
81.2%
IN LABOR FORCE | AGE 30-34
0.0/ 100
METRIC RATING
322nd/ 347
METRIC RANK
84.6%
IN LABOR FORCE | AGE 30-34
29.7/ 100
METRIC RATING
186th/ 347
METRIC RANK
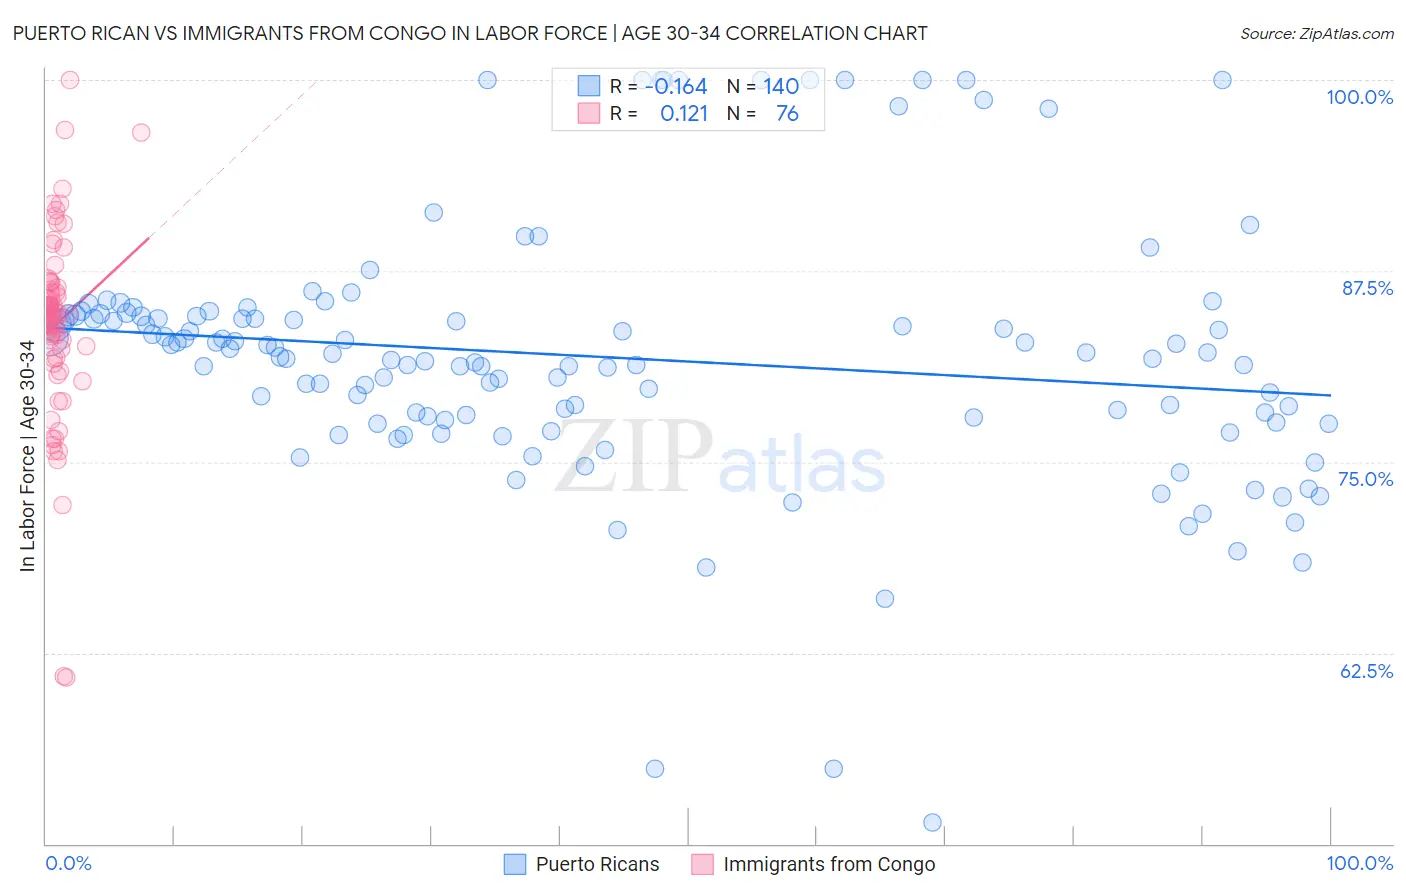
Puerto Rican vs Immigrants from Congo In Labor Force | Age 30-34 Correlation Chart
The statistical analysis conducted on geographies consisting of 527,590,157 people shows a poor negative correlation between the proportion of Puerto Ricans and labor force participation rate among population between the ages 30 and 34 in the United States with a correlation coefficient (R) of -0.164 and weighted average of 81.2%. Similarly, the statistical analysis conducted on geographies consisting of 92,110,351 people shows a poor positive correlation between the proportion of Immigrants from Congo and labor force participation rate among population between the ages 30 and 34 in the United States with a correlation coefficient (R) of 0.121 and weighted average of 84.6%, a difference of 4.1%.
In Labor Force | Age 30-34 Correlation Summary
| Measurement | Puerto Rican | Immigrants from Congo |
| Minimum | 51.4% | 60.9% |
| Maximum | 100.0% | 100.0% |
| Range | 48.6% | 39.1% |
| Mean | 81.9% | 84.0% |
| Median | 82.0% | 84.7% |
| Interquartile 25% (IQ1) | 77.8% | 82.1% |
| Interquartile 75% (IQ3) | 84.6% | 86.3% |
| Interquartile Range (IQR) | 6.8% | 4.2% |
| Standard Deviation (Sample) | 8.5% | 6.3% |
| Standard Deviation (Population) | 8.4% | 6.2% |
Similar Demographics by In Labor Force | Age 30-34
Demographics Similar to Puerto Ricans by In Labor Force | Age 30-34
In terms of in labor force | age 30-34, the demographic groups most similar to Puerto Ricans are Paiute (81.2%, a difference of 0.050%), Cheyenne (81.1%, a difference of 0.080%), Alaska Native (81.3%, a difference of 0.16%), Dutch West Indian (81.0%, a difference of 0.23%), and Yaqui (81.4%, a difference of 0.24%).
| Demographics | Rating | Rank | In Labor Force | Age 30-34 |
| Cherokee | 0.0 /100 | #315 | Tragic 81.6% |
| Immigrants | Azores | 0.0 /100 | #316 | Tragic 81.5% |
| Arapaho | 0.0 /100 | #317 | Tragic 81.5% |
| Choctaw | 0.0 /100 | #318 | Tragic 81.4% |
| Shoshone | 0.0 /100 | #319 | Tragic 81.4% |
| Yaqui | 0.0 /100 | #320 | Tragic 81.4% |
| Alaska Natives | 0.0 /100 | #321 | Tragic 81.3% |
| Puerto Ricans | 0.0 /100 | #322 | Tragic 81.2% |
| Paiute | 0.0 /100 | #323 | Tragic 81.2% |
| Cheyenne | 0.0 /100 | #324 | Tragic 81.1% |
| Dutch West Indians | 0.0 /100 | #325 | Tragic 81.0% |
| Seminole | 0.0 /100 | #326 | Tragic 80.8% |
| Colville | 0.0 /100 | #327 | Tragic 80.7% |
| Sioux | 0.0 /100 | #328 | Tragic 80.4% |
| Creek | 0.0 /100 | #329 | Tragic 80.4% |
Demographics Similar to Immigrants from Congo by In Labor Force | Age 30-34
In terms of in labor force | age 30-34, the demographic groups most similar to Immigrants from Congo are Costa Rican (84.6%, a difference of 0.0%), Taiwanese (84.6%, a difference of 0.0%), Immigrants from Philippines (84.6%, a difference of 0.010%), Nigerian (84.5%, a difference of 0.010%), and Immigrants from North America (84.6%, a difference of 0.030%).
| Demographics | Rating | Rank | In Labor Force | Age 30-34 |
| Immigrants | Nigeria | 42.5 /100 | #179 | Average 84.6% |
| Immigrants | Netherlands | 42.1 /100 | #180 | Average 84.6% |
| Moroccans | 40.3 /100 | #181 | Average 84.6% |
| Barbadians | 36.7 /100 | #182 | Fair 84.6% |
| Immigrants | Canada | 35.0 /100 | #183 | Fair 84.6% |
| Immigrants | North America | 33.3 /100 | #184 | Fair 84.6% |
| Immigrants | Philippines | 31.5 /100 | #185 | Fair 84.6% |
| Immigrants | Congo | 29.7 /100 | #186 | Fair 84.6% |
| Costa Ricans | 29.6 /100 | #187 | Fair 84.6% |
| Taiwanese | 29.4 /100 | #188 | Fair 84.6% |
| Nigerians | 28.9 /100 | #189 | Fair 84.5% |
| Immigrants | Zaire | 25.8 /100 | #190 | Fair 84.5% |
| Hungarians | 24.8 /100 | #191 | Fair 84.5% |
| Scandinavians | 24.7 /100 | #192 | Fair 84.5% |
| Immigrants | Costa Rica | 23.9 /100 | #193 | Fair 84.5% |