Pueblo vs Immigrants from England In Labor Force | Age 20-64
COMPARE
Pueblo
Immigrants from England
In Labor Force | Age 20-64
In Labor Force | Age 20-64 Comparison
Pueblo
Immigrants from England
72.6%
IN LABOR FORCE | AGE 20-64
0.0/ 100
METRIC RATING
340th/ 347
METRIC RANK
79.2%
IN LABOR FORCE | AGE 20-64
9.3/ 100
METRIC RATING
218th/ 347
METRIC RANK
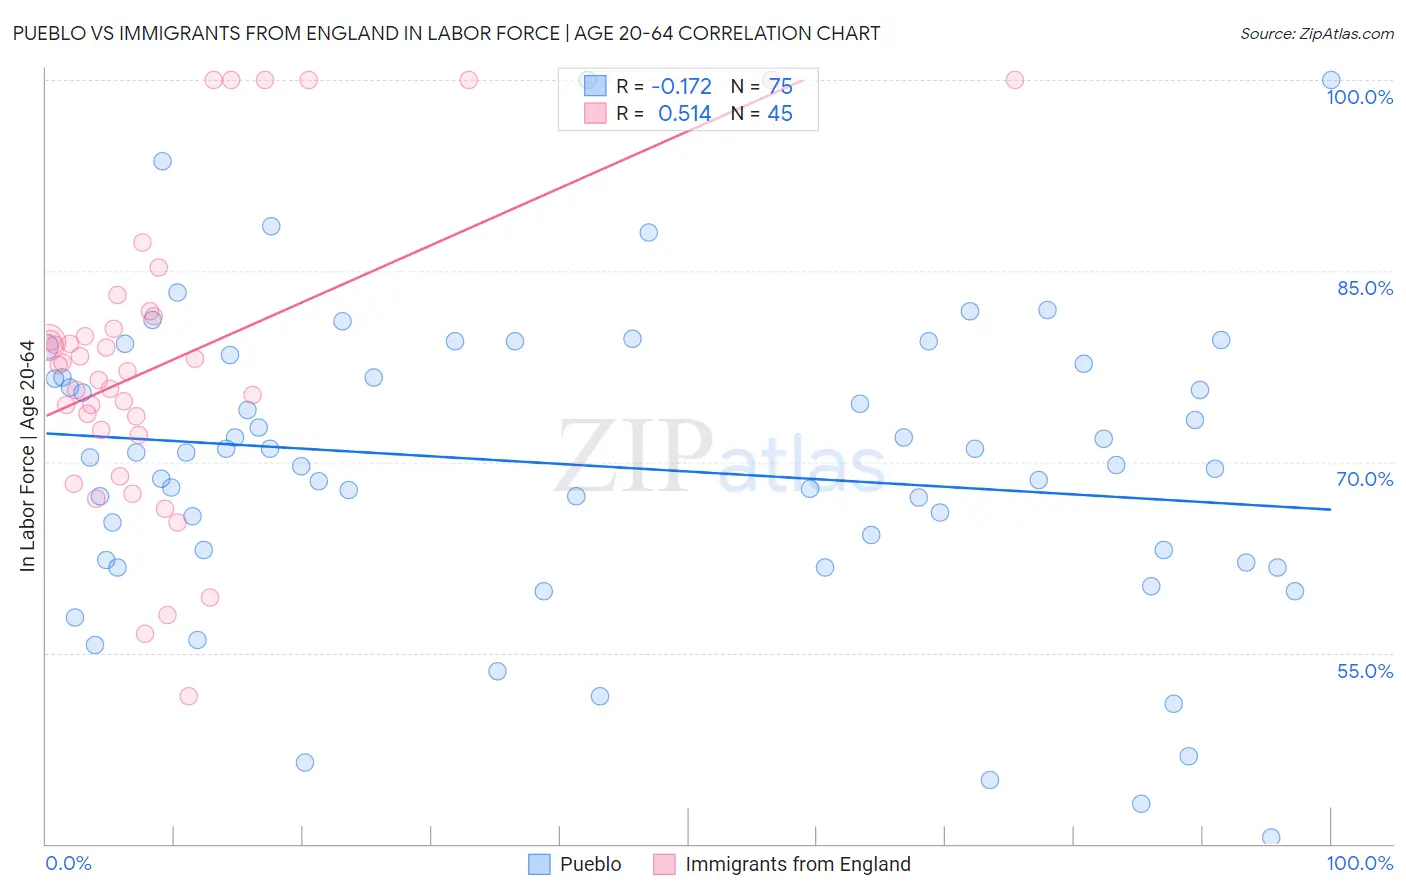
Pueblo vs Immigrants from England In Labor Force | Age 20-64 Correlation Chart
The statistical analysis conducted on geographies consisting of 120,084,084 people shows a poor negative correlation between the proportion of Pueblo and labor force participation rate among population between the ages 20 and 64 in the United States with a correlation coefficient (R) of -0.172 and weighted average of 72.6%. Similarly, the statistical analysis conducted on geographies consisting of 391,897,743 people shows a substantial positive correlation between the proportion of Immigrants from England and labor force participation rate among population between the ages 20 and 64 in the United States with a correlation coefficient (R) of 0.514 and weighted average of 79.2%, a difference of 9.0%.
In Labor Force | Age 20-64 Correlation Summary
| Measurement | Pueblo | Immigrants from England |
| Minimum | 40.5% | 51.6% |
| Maximum | 100.0% | 100.0% |
| Range | 59.5% | 48.4% |
| Mean | 69.7% | 78.0% |
| Median | 70.3% | 77.6% |
| Interquartile 25% (IQ1) | 62.3% | 72.3% |
| Interquartile 75% (IQ3) | 77.7% | 81.6% |
| Interquartile Range (IQR) | 15.4% | 9.3% |
| Standard Deviation (Sample) | 11.9% | 12.0% |
| Standard Deviation (Population) | 11.8% | 11.9% |
Similar Demographics by In Labor Force | Age 20-64
Demographics Similar to Pueblo by In Labor Force | Age 20-64
In terms of in labor force | age 20-64, the demographic groups most similar to Pueblo are Houma (72.7%, a difference of 0.15%), Immigrants from Yemen (72.3%, a difference of 0.48%), Puerto Rican (73.1%, a difference of 0.59%), Yup'ik (73.2%, a difference of 0.80%), and Crow (73.3%, a difference of 0.92%).
| Demographics | Rating | Rank | In Labor Force | Age 20-64 |
| Natives/Alaskans | 0.0 /100 | #333 | Tragic 73.9% |
| Apache | 0.0 /100 | #334 | Tragic 73.7% |
| Ute | 0.0 /100 | #335 | Tragic 73.7% |
| Crow | 0.0 /100 | #336 | Tragic 73.3% |
| Yup'ik | 0.0 /100 | #337 | Tragic 73.2% |
| Puerto Ricans | 0.0 /100 | #338 | Tragic 73.1% |
| Houma | 0.0 /100 | #339 | Tragic 72.7% |
| Pueblo | 0.0 /100 | #340 | Tragic 72.6% |
| Immigrants | Yemen | 0.0 /100 | #341 | Tragic 72.3% |
| Yuman | 0.0 /100 | #342 | Tragic 71.7% |
| Hopi | 0.0 /100 | #343 | Tragic 71.7% |
| Lumbee | 0.0 /100 | #344 | Tragic 70.6% |
| Tohono O'odham | 0.0 /100 | #345 | Tragic 70.4% |
| Navajo | 0.0 /100 | #346 | Tragic 69.2% |
| Pima | 0.0 /100 | #347 | Tragic 69.0% |
Demographics Similar to Immigrants from England by In Labor Force | Age 20-64
In terms of in labor force | age 20-64, the demographic groups most similar to Immigrants from England are French Canadian (79.2%, a difference of 0.020%), Immigrants from Western Asia (79.2%, a difference of 0.040%), Immigrants (79.2%, a difference of 0.040%), Arab (79.2%, a difference of 0.050%), and Immigrants from Armenia (79.2%, a difference of 0.060%).
| Demographics | Rating | Rank | In Labor Force | Age 20-64 |
| Europeans | 15.3 /100 | #211 | Poor 79.3% |
| Irish | 13.2 /100 | #212 | Poor 79.3% |
| Immigrants | Portugal | 12.8 /100 | #213 | Poor 79.3% |
| Immigrants | Armenia | 12.2 /100 | #214 | Poor 79.2% |
| Immigrants | Norway | 12.0 /100 | #215 | Poor 79.2% |
| Arabs | 11.4 /100 | #216 | Poor 79.2% |
| Immigrants | Western Asia | 11.0 /100 | #217 | Poor 79.2% |
| Immigrants | England | 9.3 /100 | #218 | Tragic 79.2% |
| French Canadians | 8.4 /100 | #219 | Tragic 79.2% |
| Immigrants | Immigrants | 7.7 /100 | #220 | Tragic 79.2% |
| Hungarians | 7.2 /100 | #221 | Tragic 79.2% |
| Immigrants | Panama | 6.9 /100 | #222 | Tragic 79.1% |
| Canadians | 6.8 /100 | #223 | Tragic 79.1% |
| Immigrants | Uzbekistan | 6.8 /100 | #224 | Tragic 79.1% |
| Portuguese | 6.4 /100 | #225 | Tragic 79.1% |