Pueblo vs Immigrants from Uganda In Labor Force | Age 20-64
COMPARE
Pueblo
Immigrants from Uganda
In Labor Force | Age 20-64
In Labor Force | Age 20-64 Comparison
Pueblo
Immigrants from Uganda
72.6%
IN LABOR FORCE | AGE 20-64
0.0/ 100
METRIC RATING
340th/ 347
METRIC RANK
80.7%
IN LABOR FORCE | AGE 20-64
99.9/ 100
METRIC RATING
28th/ 347
METRIC RANK
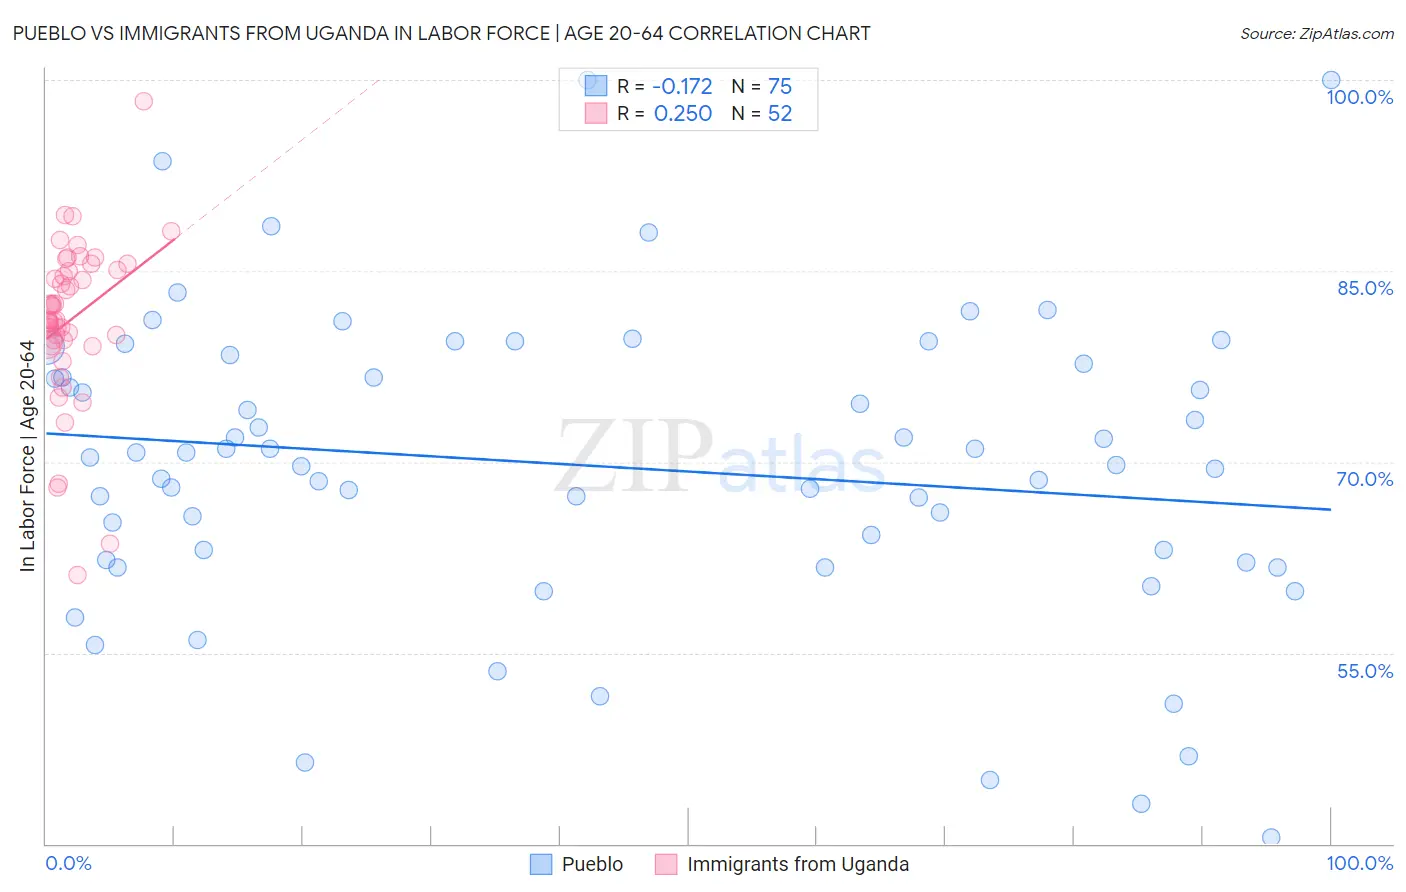
Pueblo vs Immigrants from Uganda In Labor Force | Age 20-64 Correlation Chart
The statistical analysis conducted on geographies consisting of 120,084,084 people shows a poor negative correlation between the proportion of Pueblo and labor force participation rate among population between the ages 20 and 64 in the United States with a correlation coefficient (R) of -0.172 and weighted average of 72.6%. Similarly, the statistical analysis conducted on geographies consisting of 125,981,186 people shows a weak positive correlation between the proportion of Immigrants from Uganda and labor force participation rate among population between the ages 20 and 64 in the United States with a correlation coefficient (R) of 0.250 and weighted average of 80.7%, a difference of 11.2%.
In Labor Force | Age 20-64 Correlation Summary
| Measurement | Pueblo | Immigrants from Uganda |
| Minimum | 40.5% | 61.1% |
| Maximum | 100.0% | 98.3% |
| Range | 59.5% | 37.2% |
| Mean | 69.7% | 81.2% |
| Median | 70.3% | 81.1% |
| Interquartile 25% (IQ1) | 62.3% | 79.5% |
| Interquartile 75% (IQ3) | 77.7% | 85.0% |
| Interquartile Range (IQR) | 15.4% | 5.5% |
| Standard Deviation (Sample) | 11.9% | 6.3% |
| Standard Deviation (Population) | 11.8% | 6.3% |
Similar Demographics by In Labor Force | Age 20-64
Demographics Similar to Pueblo by In Labor Force | Age 20-64
In terms of in labor force | age 20-64, the demographic groups most similar to Pueblo are Houma (72.7%, a difference of 0.15%), Immigrants from Yemen (72.3%, a difference of 0.48%), Puerto Rican (73.1%, a difference of 0.59%), Yup'ik (73.2%, a difference of 0.80%), and Crow (73.3%, a difference of 0.92%).
| Demographics | Rating | Rank | In Labor Force | Age 20-64 |
| Natives/Alaskans | 0.0 /100 | #333 | Tragic 73.9% |
| Apache | 0.0 /100 | #334 | Tragic 73.7% |
| Ute | 0.0 /100 | #335 | Tragic 73.7% |
| Crow | 0.0 /100 | #336 | Tragic 73.3% |
| Yup'ik | 0.0 /100 | #337 | Tragic 73.2% |
| Puerto Ricans | 0.0 /100 | #338 | Tragic 73.1% |
| Houma | 0.0 /100 | #339 | Tragic 72.7% |
| Pueblo | 0.0 /100 | #340 | Tragic 72.6% |
| Immigrants | Yemen | 0.0 /100 | #341 | Tragic 72.3% |
| Yuman | 0.0 /100 | #342 | Tragic 71.7% |
| Hopi | 0.0 /100 | #343 | Tragic 71.7% |
| Lumbee | 0.0 /100 | #344 | Tragic 70.6% |
| Tohono O'odham | 0.0 /100 | #345 | Tragic 70.4% |
| Navajo | 0.0 /100 | #346 | Tragic 69.2% |
| Pima | 0.0 /100 | #347 | Tragic 69.0% |
Demographics Similar to Immigrants from Uganda by In Labor Force | Age 20-64
In terms of in labor force | age 20-64, the demographic groups most similar to Immigrants from Uganda are Immigrants from Kenya (80.7%, a difference of 0.010%), Immigrants from South Central Asia (80.7%, a difference of 0.020%), Immigrants from North Macedonia (80.7%, a difference of 0.020%), Immigrants from Lithuania (80.7%, a difference of 0.040%), and Immigrants from Ireland (80.7%, a difference of 0.050%).
| Demographics | Rating | Rank | In Labor Force | Age 20-64 |
| Liberians | 100.0 /100 | #21 | Exceptional 80.9% |
| Sudanese | 100.0 /100 | #22 | Exceptional 80.8% |
| Immigrants | Bosnia and Herzegovina | 100.0 /100 | #23 | Exceptional 80.8% |
| Immigrants | Morocco | 100.0 /100 | #24 | Exceptional 80.8% |
| Kenyans | 100.0 /100 | #25 | Exceptional 80.8% |
| Immigrants | Serbia | 100.0 /100 | #26 | Exceptional 80.8% |
| Immigrants | Kenya | 99.9 /100 | #27 | Exceptional 80.7% |
| Immigrants | Uganda | 99.9 /100 | #28 | Exceptional 80.7% |
| Immigrants | South Central Asia | 99.9 /100 | #29 | Exceptional 80.7% |
| Immigrants | North Macedonia | 99.9 /100 | #30 | Exceptional 80.7% |
| Immigrants | Lithuania | 99.9 /100 | #31 | Exceptional 80.7% |
| Immigrants | Ireland | 99.9 /100 | #32 | Exceptional 80.7% |
| Chinese | 99.9 /100 | #33 | Exceptional 80.7% |
| Immigrants | Brazil | 99.9 /100 | #34 | Exceptional 80.7% |
| Immigrants | Poland | 99.9 /100 | #35 | Exceptional 80.6% |