Pueblo vs Czechoslovakian Births to Unmarried Women
COMPARE
Pueblo
Czechoslovakian
Births to Unmarried Women
Births to Unmarried Women Comparison
Pueblo
Czechoslovakians
53.7%
BIRTHS TO UNMARRIED WOMEN
0.0/ 100
METRIC RATING
346th/ 347
METRIC RANK
32.0%
BIRTHS TO UNMARRIED WOMEN
38.0/ 100
METRIC RATING
187th/ 347
METRIC RANK
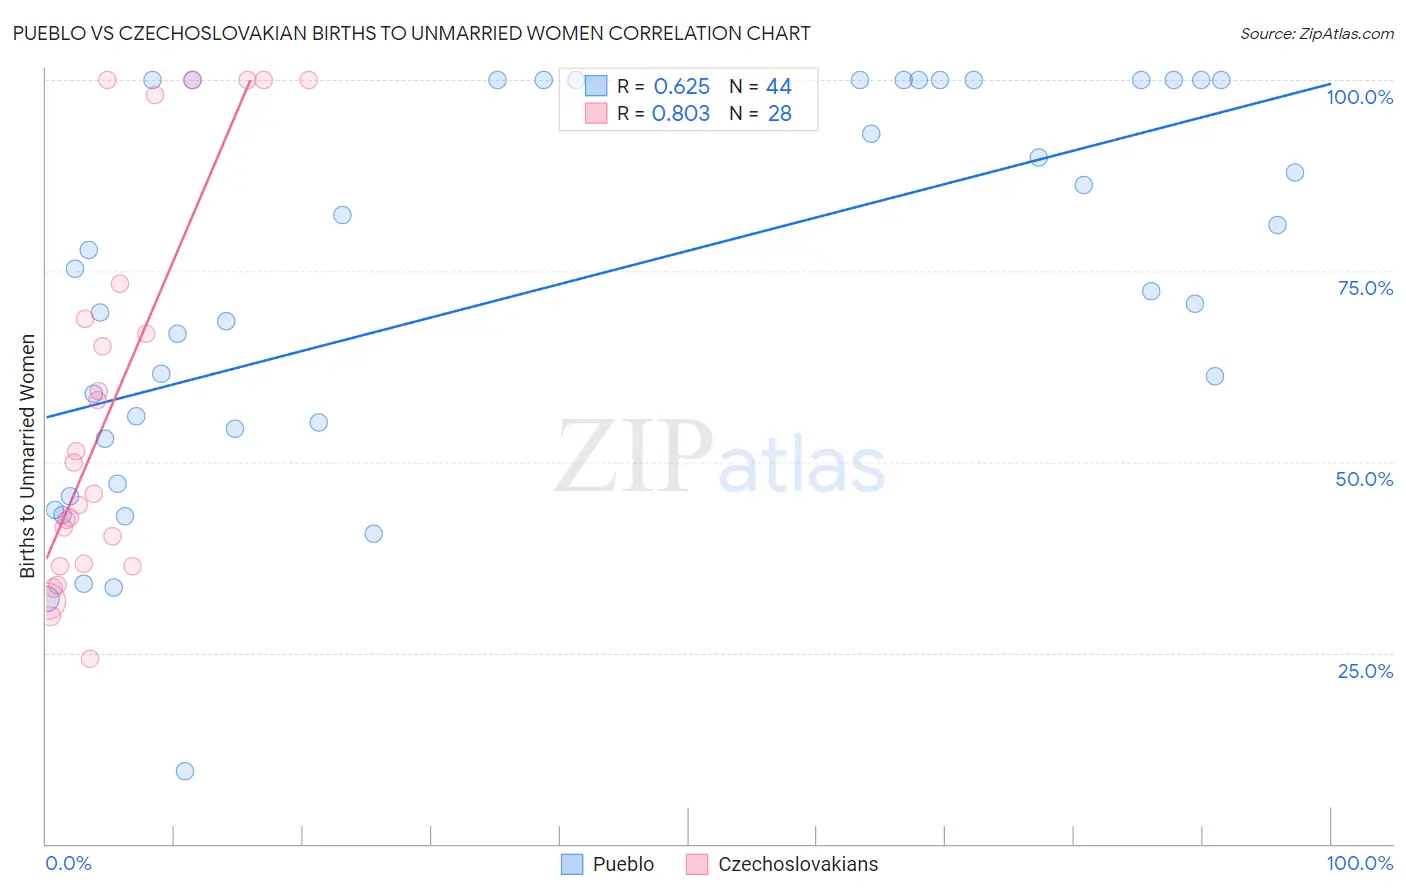
Pueblo vs Czechoslovakian Births to Unmarried Women Correlation Chart
The statistical analysis conducted on geographies consisting of 117,205,072 people shows a significant positive correlation between the proportion of Pueblo and percentage of births to unmarried women in the United States with a correlation coefficient (R) of 0.625 and weighted average of 53.7%. Similarly, the statistical analysis conducted on geographies consisting of 341,149,563 people shows a very strong positive correlation between the proportion of Czechoslovakians and percentage of births to unmarried women in the United States with a correlation coefficient (R) of 0.803 and weighted average of 32.0%, a difference of 67.5%.
Births to Unmarried Women Correlation Summary
| Measurement | Pueblo | Czechoslovakian |
| Minimum | 9.5% | 24.3% |
| Maximum | 100.0% | 100.0% |
| Range | 90.5% | 75.7% |
| Mean | 72.6% | 57.5% |
| Median | 73.8% | 47.9% |
| Interquartile 25% (IQ1) | 53.7% | 36.5% |
| Interquartile 75% (IQ3) | 100.0% | 71.0% |
| Interquartile Range (IQR) | 46.3% | 34.5% |
| Standard Deviation (Sample) | 25.2% | 25.5% |
| Standard Deviation (Population) | 24.9% | 25.1% |
Similar Demographics by Births to Unmarried Women
Demographics Similar to Pueblo by Births to Unmarried Women
In terms of births to unmarried women, the demographic groups most similar to Pueblo are Inupiat (52.1%, a difference of 3.0%), Navajo (51.5%, a difference of 4.2%), Pima (51.5%, a difference of 4.2%), Menominee (51.1%, a difference of 5.0%), and Yup'ik (56.4%, a difference of 5.2%).
| Demographics | Rating | Rank | Births to Unmarried Women |
| Blacks/African Americans | 0.0 /100 | #333 | Tragic 44.3% |
| Yuman | 0.0 /100 | #334 | Tragic 44.4% |
| Colville | 0.0 /100 | #335 | Tragic 45.3% |
| Puerto Ricans | 0.0 /100 | #336 | Tragic 45.7% |
| Houma | 0.0 /100 | #337 | Tragic 46.6% |
| Arapaho | 0.0 /100 | #338 | Tragic 47.1% |
| Lumbee | 0.0 /100 | #339 | Tragic 48.2% |
| Tohono O'odham | 0.0 /100 | #340 | Tragic 49.8% |
| Hopi | 0.0 /100 | #341 | Tragic 50.8% |
| Menominee | 0.0 /100 | #342 | Tragic 51.1% |
| Pima | 0.0 /100 | #343 | Tragic 51.5% |
| Navajo | 0.0 /100 | #344 | Tragic 51.5% |
| Inupiat | 0.0 /100 | #345 | Tragic 52.1% |
| Pueblo | 0.0 /100 | #346 | Tragic 53.7% |
| Yup'ik | 0.0 /100 | #347 | Tragic 56.4% |
Demographics Similar to Czechoslovakians by Births to Unmarried Women
In terms of births to unmarried women, the demographic groups most similar to Czechoslovakians are Welsh (32.0%, a difference of 0.020%), Osage (32.1%, a difference of 0.090%), Immigrants from Kenya (32.1%, a difference of 0.11%), German (32.0%, a difference of 0.15%), and Immigrants from South America (32.0%, a difference of 0.26%).
| Demographics | Rating | Rank | Births to Unmarried Women |
| Moroccans | 45.7 /100 | #180 | Average 31.8% |
| Immigrants | Peru | 45.1 /100 | #181 | Average 31.8% |
| Kenyans | 43.0 /100 | #182 | Average 31.9% |
| Canadians | 41.4 /100 | #183 | Average 31.9% |
| Immigrants | South America | 40.7 /100 | #184 | Average 32.0% |
| Germans | 39.5 /100 | #185 | Fair 32.0% |
| Welsh | 38.2 /100 | #186 | Fair 32.0% |
| Czechoslovakians | 38.0 /100 | #187 | Fair 32.0% |
| Osage | 37.1 /100 | #188 | Fair 32.1% |
| Immigrants | Kenya | 36.9 /100 | #189 | Fair 32.1% |
| Tlingit-Haida | 32.6 /100 | #190 | Fair 32.2% |
| Irish | 32.4 /100 | #191 | Fair 32.2% |
| Colombians | 31.9 /100 | #192 | Fair 32.2% |
| Fijians | 31.1 /100 | #193 | Fair 32.3% |
| Sudanese | 27.3 /100 | #194 | Fair 32.4% |