Pueblo vs Immigrants from Belize In Labor Force | Age 20-64
COMPARE
Pueblo
Immigrants from Belize
In Labor Force | Age 20-64
In Labor Force | Age 20-64 Comparison
Pueblo
Immigrants from Belize
72.6%
IN LABOR FORCE | AGE 20-64
0.0/ 100
METRIC RATING
340th/ 347
METRIC RANK
78.0%
IN LABOR FORCE | AGE 20-64
0.0/ 100
METRIC RATING
286th/ 347
METRIC RANK
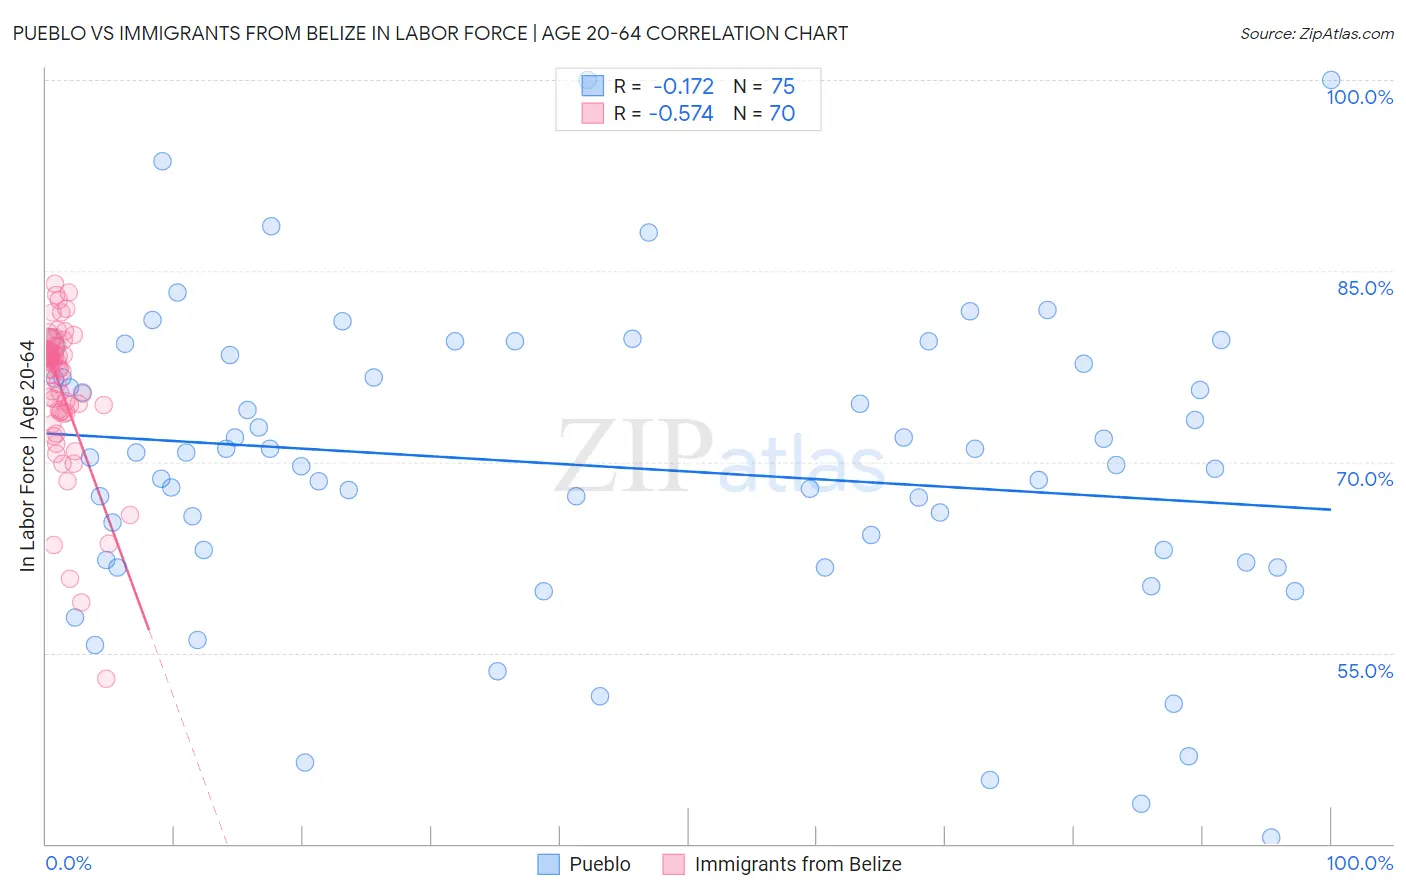
Pueblo vs Immigrants from Belize In Labor Force | Age 20-64 Correlation Chart
The statistical analysis conducted on geographies consisting of 120,084,084 people shows a poor negative correlation between the proportion of Pueblo and labor force participation rate among population between the ages 20 and 64 in the United States with a correlation coefficient (R) of -0.172 and weighted average of 72.6%. Similarly, the statistical analysis conducted on geographies consisting of 130,318,427 people shows a substantial negative correlation between the proportion of Immigrants from Belize and labor force participation rate among population between the ages 20 and 64 in the United States with a correlation coefficient (R) of -0.574 and weighted average of 78.0%, a difference of 7.4%.
In Labor Force | Age 20-64 Correlation Summary
| Measurement | Pueblo | Immigrants from Belize |
| Minimum | 40.5% | 53.0% |
| Maximum | 100.0% | 84.0% |
| Range | 59.5% | 31.0% |
| Mean | 69.7% | 75.6% |
| Median | 70.3% | 77.3% |
| Interquartile 25% (IQ1) | 62.3% | 73.9% |
| Interquartile 75% (IQ3) | 77.7% | 78.8% |
| Interquartile Range (IQR) | 15.4% | 4.9% |
| Standard Deviation (Sample) | 11.9% | 5.8% |
| Standard Deviation (Population) | 11.8% | 5.7% |
Similar Demographics by In Labor Force | Age 20-64
Demographics Similar to Pueblo by In Labor Force | Age 20-64
In terms of in labor force | age 20-64, the demographic groups most similar to Pueblo are Houma (72.7%, a difference of 0.15%), Immigrants from Yemen (72.3%, a difference of 0.48%), Puerto Rican (73.1%, a difference of 0.59%), Yup'ik (73.2%, a difference of 0.80%), and Crow (73.3%, a difference of 0.92%).
| Demographics | Rating | Rank | In Labor Force | Age 20-64 |
| Natives/Alaskans | 0.0 /100 | #333 | Tragic 73.9% |
| Apache | 0.0 /100 | #334 | Tragic 73.7% |
| Ute | 0.0 /100 | #335 | Tragic 73.7% |
| Crow | 0.0 /100 | #336 | Tragic 73.3% |
| Yup'ik | 0.0 /100 | #337 | Tragic 73.2% |
| Puerto Ricans | 0.0 /100 | #338 | Tragic 73.1% |
| Houma | 0.0 /100 | #339 | Tragic 72.7% |
| Pueblo | 0.0 /100 | #340 | Tragic 72.6% |
| Immigrants | Yemen | 0.0 /100 | #341 | Tragic 72.3% |
| Yuman | 0.0 /100 | #342 | Tragic 71.7% |
| Hopi | 0.0 /100 | #343 | Tragic 71.7% |
| Lumbee | 0.0 /100 | #344 | Tragic 70.6% |
| Tohono O'odham | 0.0 /100 | #345 | Tragic 70.4% |
| Navajo | 0.0 /100 | #346 | Tragic 69.2% |
| Pima | 0.0 /100 | #347 | Tragic 69.0% |
Demographics Similar to Immigrants from Belize by In Labor Force | Age 20-64
In terms of in labor force | age 20-64, the demographic groups most similar to Immigrants from Belize are Vietnamese (78.0%, a difference of 0.0%), Osage (78.0%, a difference of 0.010%), Hmong (77.9%, a difference of 0.080%), African (77.9%, a difference of 0.090%), and Immigrants from Bangladesh (77.9%, a difference of 0.10%).
| Demographics | Rating | Rank | In Labor Force | Age 20-64 |
| Belizeans | 0.0 /100 | #279 | Tragic 78.2% |
| Immigrants | Dominica | 0.0 /100 | #280 | Tragic 78.1% |
| Guyanese | 0.0 /100 | #281 | Tragic 78.1% |
| Immigrants | St. Vincent and the Grenadines | 0.0 /100 | #282 | Tragic 78.1% |
| Immigrants | Nonimmigrants | 0.0 /100 | #283 | Tragic 78.1% |
| Immigrants | Guyana | 0.0 /100 | #284 | Tragic 78.1% |
| Osage | 0.0 /100 | #285 | Tragic 78.0% |
| Immigrants | Belize | 0.0 /100 | #286 | Tragic 78.0% |
| Vietnamese | 0.0 /100 | #287 | Tragic 78.0% |
| Hmong | 0.0 /100 | #288 | Tragic 77.9% |
| Africans | 0.0 /100 | #289 | Tragic 77.9% |
| Immigrants | Bangladesh | 0.0 /100 | #290 | Tragic 77.9% |
| Spanish Americans | 0.0 /100 | #291 | Tragic 77.8% |
| Immigrants | Azores | 0.0 /100 | #292 | Tragic 77.8% |
| Delaware | 0.0 /100 | #293 | Tragic 77.8% |