Potawatomi vs French Canadian In Labor Force | Age > 16
COMPARE
Potawatomi
French Canadian
In Labor Force | Age > 16
In Labor Force | Age > 16 Comparison
Potawatomi
French Canadians
62.8%
IN LABOR FORCE | AGE > 16
0.0/ 100
METRIC RATING
315th/ 347
METRIC RANK
64.0%
IN LABOR FORCE | AGE > 16
0.2/ 100
METRIC RATING
281st/ 347
METRIC RANK
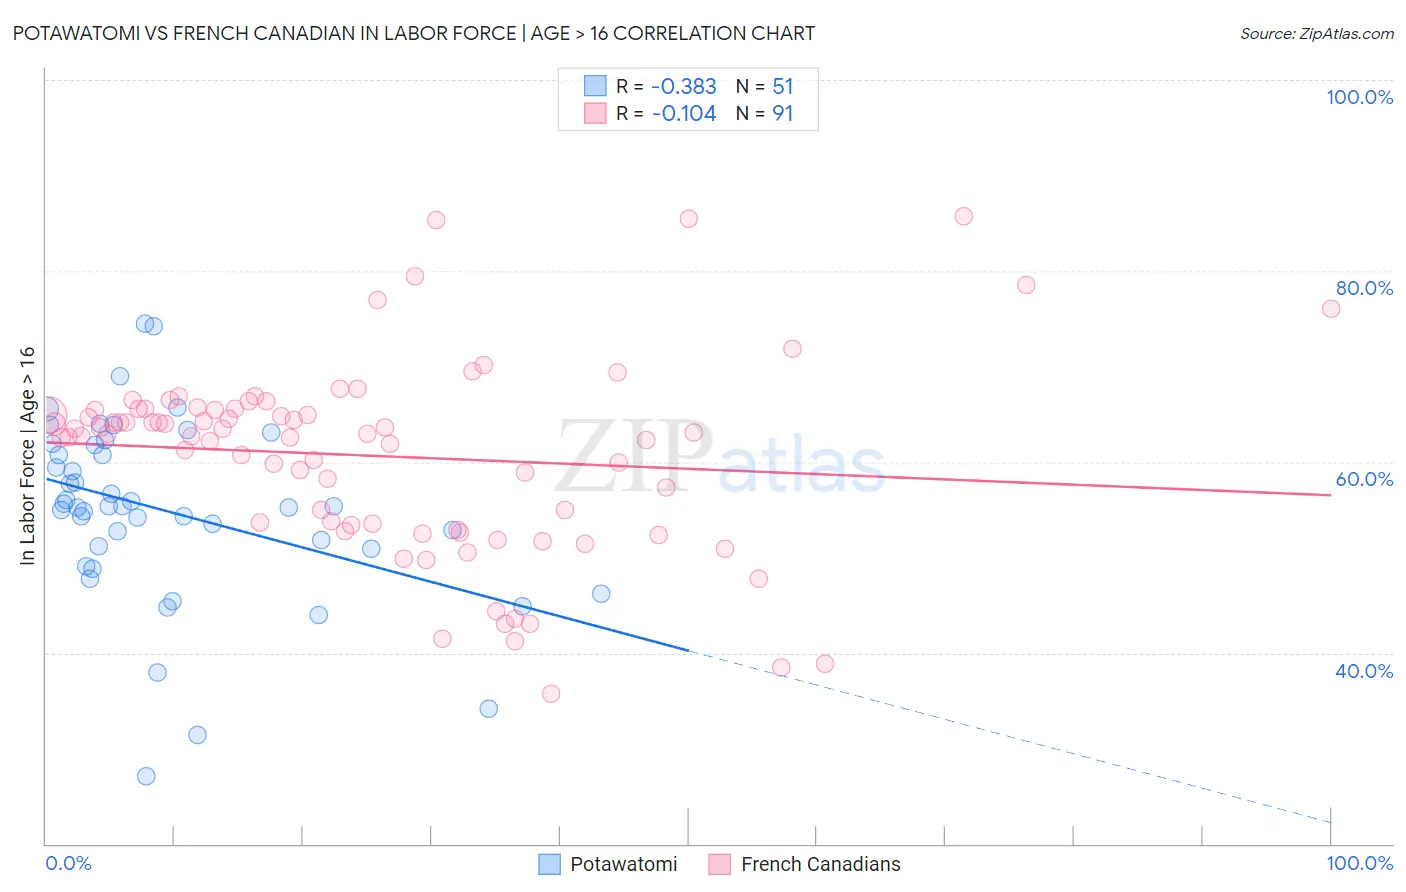
Potawatomi vs French Canadian In Labor Force | Age > 16 Correlation Chart
The statistical analysis conducted on geographies consisting of 117,774,216 people shows a mild negative correlation between the proportion of Potawatomi and labor force participation rate among population ages 16 and over in the United States with a correlation coefficient (R) of -0.383 and weighted average of 62.8%. Similarly, the statistical analysis conducted on geographies consisting of 502,679,464 people shows a poor negative correlation between the proportion of French Canadians and labor force participation rate among population ages 16 and over in the United States with a correlation coefficient (R) of -0.104 and weighted average of 64.0%, a difference of 1.9%.
In Labor Force | Age > 16 Correlation Summary
| Measurement | Potawatomi | French Canadian |
| Minimum | 27.1% | 35.7% |
| Maximum | 74.5% | 85.7% |
| Range | 47.4% | 50.0% |
| Mean | 54.8% | 60.6% |
| Median | 55.3% | 62.9% |
| Interquartile 25% (IQ1) | 50.9% | 53.4% |
| Interquartile 75% (IQ3) | 61.7% | 65.5% |
| Interquartile Range (IQR) | 10.8% | 12.1% |
| Standard Deviation (Sample) | 9.5% | 10.0% |
| Standard Deviation (Population) | 9.4% | 10.0% |
Similar Demographics by In Labor Force | Age > 16
Demographics Similar to Potawatomi by In Labor Force | Age > 16
In terms of in labor force | age > 16, the demographic groups most similar to Potawatomi are Yup'ik (62.7%, a difference of 0.22%), Yaqui (63.0%, a difference of 0.35%), Chippewa (63.1%, a difference of 0.44%), Iroquois (63.2%, a difference of 0.57%), and Blackfeet (63.2%, a difference of 0.64%).
| Demographics | Rating | Rank | In Labor Force | Age > 16 |
| Pennsylvania Germans | 0.0 /100 | #308 | Tragic 63.4% |
| Scotch-Irish | 0.0 /100 | #309 | Tragic 63.3% |
| Shoshone | 0.0 /100 | #310 | Tragic 63.2% |
| Blackfeet | 0.0 /100 | #311 | Tragic 63.2% |
| Iroquois | 0.0 /100 | #312 | Tragic 63.2% |
| Chippewa | 0.0 /100 | #313 | Tragic 63.1% |
| Yaqui | 0.0 /100 | #314 | Tragic 63.0% |
| Potawatomi | 0.0 /100 | #315 | Tragic 62.8% |
| Yup'ik | 0.0 /100 | #316 | Tragic 62.7% |
| Kiowa | 0.0 /100 | #317 | Tragic 62.4% |
| Chickasaw | 0.0 /100 | #318 | Tragic 62.3% |
| Arapaho | 0.0 /100 | #319 | Tragic 62.1% |
| Yakama | 0.0 /100 | #320 | Tragic 62.1% |
| Americans | 0.0 /100 | #321 | Tragic 62.1% |
| Ottawa | 0.0 /100 | #322 | Tragic 62.0% |
Demographics Similar to French Canadians by In Labor Force | Age > 16
In terms of in labor force | age > 16, the demographic groups most similar to French Canadians are Immigrants from St. Vincent and the Grenadines (64.0%, a difference of 0.0%), Welsh (64.0%, a difference of 0.010%), Assyrian/Chaldean/Syriac (64.0%, a difference of 0.040%), Immigrants from Bahamas (64.0%, a difference of 0.070%), and Immigrants from Guyana (64.0%, a difference of 0.080%).
| Demographics | Rating | Rank | In Labor Force | Age > 16 |
| Immigrants | Cuba | 0.3 /100 | #274 | Tragic 64.1% |
| Mexicans | 0.3 /100 | #275 | Tragic 64.1% |
| French American Indians | 0.3 /100 | #276 | Tragic 64.1% |
| Immigrants | Bahamas | 0.3 /100 | #277 | Tragic 64.0% |
| Assyrians/Chaldeans/Syriacs | 0.3 /100 | #278 | Tragic 64.0% |
| Welsh | 0.2 /100 | #279 | Tragic 64.0% |
| Immigrants | St. Vincent and the Grenadines | 0.2 /100 | #280 | Tragic 64.0% |
| French Canadians | 0.2 /100 | #281 | Tragic 64.0% |
| Immigrants | Guyana | 0.2 /100 | #282 | Tragic 64.0% |
| Immigrants | Germany | 0.1 /100 | #283 | Tragic 63.9% |
| French | 0.1 /100 | #284 | Tragic 63.9% |
| Slovaks | 0.1 /100 | #285 | Tragic 63.9% |
| Immigrants | Austria | 0.1 /100 | #286 | Tragic 63.9% |
| Scottish | 0.1 /100 | #287 | Tragic 63.9% |
| Spanish | 0.1 /100 | #288 | Tragic 63.9% |