Potawatomi vs Malaysian In Labor Force | Age > 16
COMPARE
Potawatomi
Malaysian
In Labor Force | Age > 16
In Labor Force | Age > 16 Comparison
Potawatomi
Malaysians
62.8%
IN LABOR FORCE | AGE > 16
0.0/ 100
METRIC RATING
315th/ 347
METRIC RANK
66.1%
IN LABOR FORCE | AGE > 16
99.6/ 100
METRIC RATING
80th/ 347
METRIC RANK
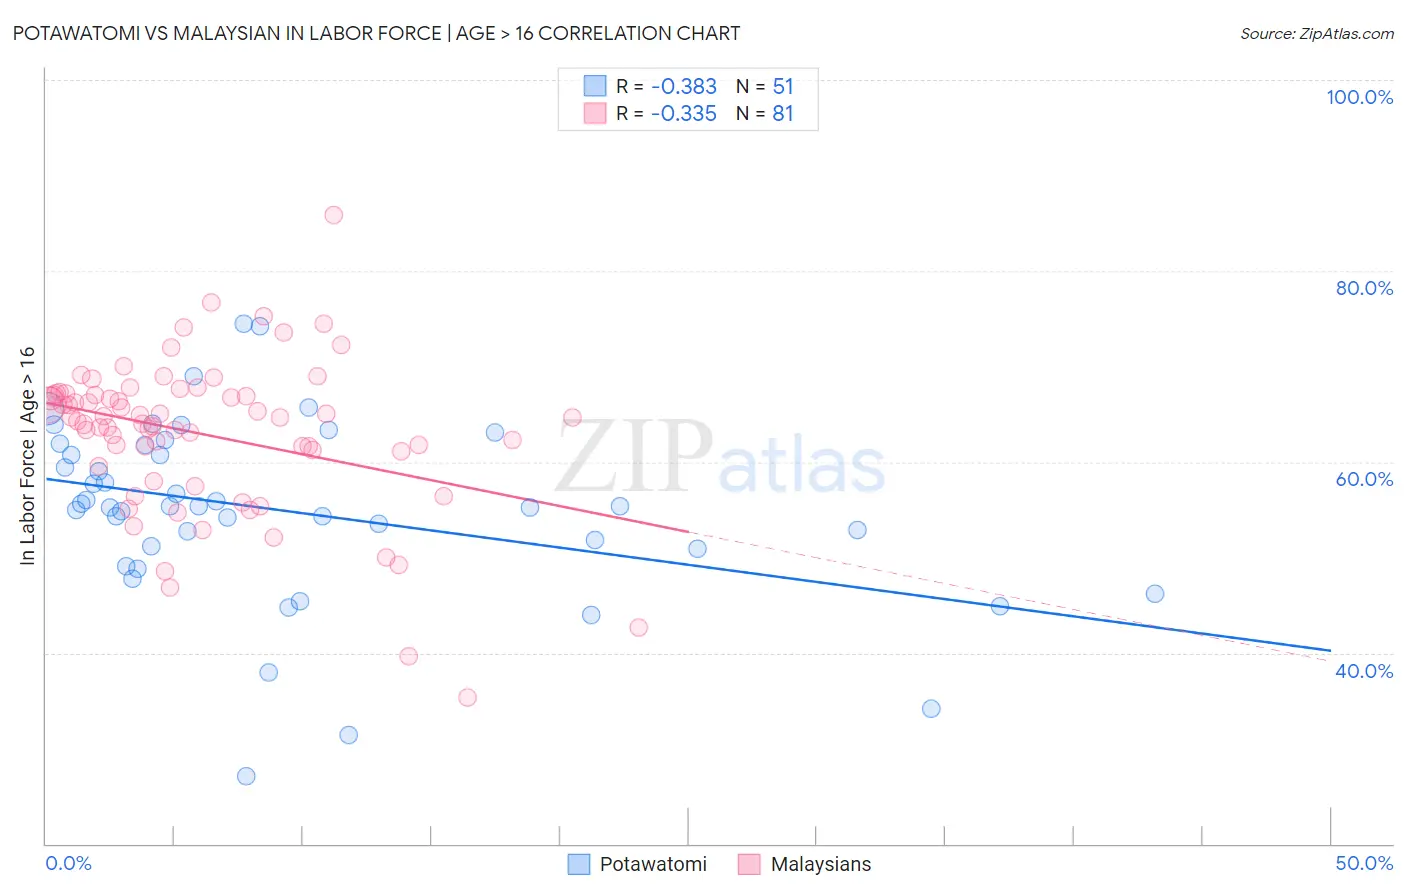
Potawatomi vs Malaysian In Labor Force | Age > 16 Correlation Chart
The statistical analysis conducted on geographies consisting of 117,774,216 people shows a mild negative correlation between the proportion of Potawatomi and labor force participation rate among population ages 16 and over in the United States with a correlation coefficient (R) of -0.383 and weighted average of 62.8%. Similarly, the statistical analysis conducted on geographies consisting of 226,111,861 people shows a mild negative correlation between the proportion of Malaysians and labor force participation rate among population ages 16 and over in the United States with a correlation coefficient (R) of -0.335 and weighted average of 66.1%, a difference of 5.2%.
In Labor Force | Age > 16 Correlation Summary
| Measurement | Potawatomi | Malaysian |
| Minimum | 27.1% | 35.3% |
| Maximum | 74.5% | 85.8% |
| Range | 47.4% | 50.5% |
| Mean | 54.8% | 62.9% |
| Median | 55.3% | 64.6% |
| Interquartile 25% (IQ1) | 50.9% | 60.3% |
| Interquartile 75% (IQ3) | 61.7% | 67.1% |
| Interquartile Range (IQR) | 10.8% | 6.8% |
| Standard Deviation (Sample) | 9.5% | 8.1% |
| Standard Deviation (Population) | 9.4% | 8.1% |
Similar Demographics by In Labor Force | Age > 16
Demographics Similar to Potawatomi by In Labor Force | Age > 16
In terms of in labor force | age > 16, the demographic groups most similar to Potawatomi are Yup'ik (62.7%, a difference of 0.22%), Yaqui (63.0%, a difference of 0.35%), Chippewa (63.1%, a difference of 0.44%), Iroquois (63.2%, a difference of 0.57%), and Blackfeet (63.2%, a difference of 0.64%).
| Demographics | Rating | Rank | In Labor Force | Age > 16 |
| Pennsylvania Germans | 0.0 /100 | #308 | Tragic 63.4% |
| Scotch-Irish | 0.0 /100 | #309 | Tragic 63.3% |
| Shoshone | 0.0 /100 | #310 | Tragic 63.2% |
| Blackfeet | 0.0 /100 | #311 | Tragic 63.2% |
| Iroquois | 0.0 /100 | #312 | Tragic 63.2% |
| Chippewa | 0.0 /100 | #313 | Tragic 63.1% |
| Yaqui | 0.0 /100 | #314 | Tragic 63.0% |
| Potawatomi | 0.0 /100 | #315 | Tragic 62.8% |
| Yup'ik | 0.0 /100 | #316 | Tragic 62.7% |
| Kiowa | 0.0 /100 | #317 | Tragic 62.4% |
| Chickasaw | 0.0 /100 | #318 | Tragic 62.3% |
| Arapaho | 0.0 /100 | #319 | Tragic 62.1% |
| Yakama | 0.0 /100 | #320 | Tragic 62.1% |
| Americans | 0.0 /100 | #321 | Tragic 62.1% |
| Ottawa | 0.0 /100 | #322 | Tragic 62.0% |
Demographics Similar to Malaysians by In Labor Force | Age > 16
In terms of in labor force | age > 16, the demographic groups most similar to Malaysians are Turkish (66.1%, a difference of 0.010%), Immigrants from Moldova (66.1%, a difference of 0.040%), Immigrants from Asia (66.1%, a difference of 0.040%), Immigrants from Malaysia (66.1%, a difference of 0.050%), and Moroccan (66.1%, a difference of 0.050%).
| Demographics | Rating | Rank | In Labor Force | Age > 16 |
| Immigrants | Vietnam | 99.7 /100 | #73 | Exceptional 66.2% |
| Immigrants | Korea | 99.7 /100 | #74 | Exceptional 66.2% |
| Immigrants | Singapore | 99.7 /100 | #75 | Exceptional 66.2% |
| Immigrants | Malaysia | 99.6 /100 | #76 | Exceptional 66.1% |
| Immigrants | Moldova | 99.6 /100 | #77 | Exceptional 66.1% |
| Immigrants | Asia | 99.6 /100 | #78 | Exceptional 66.1% |
| Turks | 99.6 /100 | #79 | Exceptional 66.1% |
| Malaysians | 99.6 /100 | #80 | Exceptional 66.1% |
| Moroccans | 99.5 /100 | #81 | Exceptional 66.1% |
| German Russians | 99.4 /100 | #82 | Exceptional 66.1% |
| Immigrants | Jordan | 99.4 /100 | #83 | Exceptional 66.1% |
| Central Americans | 99.4 /100 | #84 | Exceptional 66.1% |
| Mongolians | 99.4 /100 | #85 | Exceptional 66.1% |
| South Americans | 99.4 /100 | #86 | Exceptional 66.0% |
| South American Indians | 99.4 /100 | #87 | Exceptional 66.0% |