Potawatomi vs White/Caucasian In Labor Force | Age > 16
COMPARE
Potawatomi
White/Caucasian
In Labor Force | Age > 16
In Labor Force | Age > 16 Comparison
Potawatomi
Whites/Caucasians
62.8%
IN LABOR FORCE | AGE > 16
0.0/ 100
METRIC RATING
315th/ 347
METRIC RANK
63.6%
IN LABOR FORCE | AGE > 16
0.0/ 100
METRIC RATING
299th/ 347
METRIC RANK
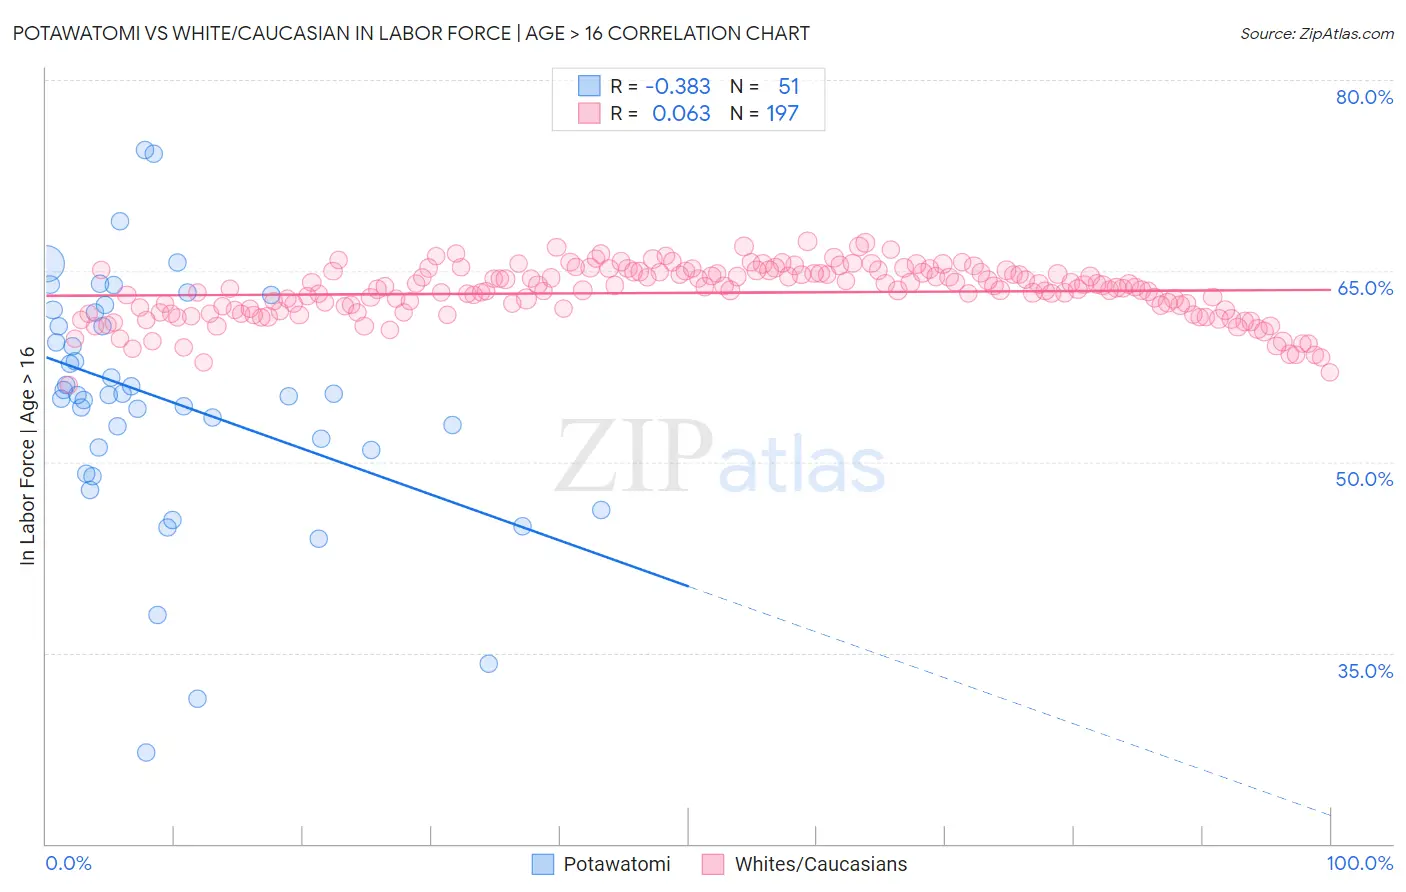
Potawatomi vs White/Caucasian In Labor Force | Age > 16 Correlation Chart
The statistical analysis conducted on geographies consisting of 117,774,216 people shows a mild negative correlation between the proportion of Potawatomi and labor force participation rate among population ages 16 and over in the United States with a correlation coefficient (R) of -0.383 and weighted average of 62.8%. Similarly, the statistical analysis conducted on geographies consisting of 584,901,305 people shows a slight positive correlation between the proportion of Whites/Caucasians and labor force participation rate among population ages 16 and over in the United States with a correlation coefficient (R) of 0.063 and weighted average of 63.6%, a difference of 1.2%.
In Labor Force | Age > 16 Correlation Summary
| Measurement | Potawatomi | White/Caucasian |
| Minimum | 27.1% | 56.1% |
| Maximum | 74.5% | 67.3% |
| Range | 47.4% | 11.3% |
| Mean | 54.8% | 63.3% |
| Median | 55.3% | 63.6% |
| Interquartile 25% (IQ1) | 50.9% | 61.8% |
| Interquartile 75% (IQ3) | 61.7% | 64.9% |
| Interquartile Range (IQR) | 10.8% | 3.1% |
| Standard Deviation (Sample) | 9.5% | 2.1% |
| Standard Deviation (Population) | 9.4% | 2.1% |
Demographics Similar to Potawatomi and Whites/Caucasians by In Labor Force | Age > 16
In terms of in labor force | age > 16, the demographic groups most similar to Potawatomi are Yup'ik (62.7%, a difference of 0.22%), Yaqui (63.0%, a difference of 0.35%), Chippewa (63.1%, a difference of 0.44%), Iroquois (63.2%, a difference of 0.57%), and Blackfeet (63.2%, a difference of 0.64%). Similarly, the demographic groups most similar to Whites/Caucasians are Immigrants from the Azores (63.6%, a difference of 0.010%), Spanish American (63.6%, a difference of 0.030%), Delaware (63.6%, a difference of 0.050%), Immigrants from Grenada (63.6%, a difference of 0.060%), and Comanche (63.6%, a difference of 0.060%).
| Demographics | Rating | Rank | In Labor Force | Age > 16 |
| Immigrants | Grenada | 0.0 /100 | #297 | Tragic 63.6% |
| Comanche | 0.0 /100 | #298 | Tragic 63.6% |
| Whites/Caucasians | 0.0 /100 | #299 | Tragic 63.6% |
| Immigrants | Azores | 0.0 /100 | #300 | Tragic 63.6% |
| Spanish Americans | 0.0 /100 | #301 | Tragic 63.6% |
| Delaware | 0.0 /100 | #302 | Tragic 63.6% |
| Cree | 0.0 /100 | #303 | Tragic 63.5% |
| Immigrants | Nonimmigrants | 0.0 /100 | #304 | Tragic 63.5% |
| Osage | 0.0 /100 | #305 | Tragic 63.5% |
| Blacks/African Americans | 0.0 /100 | #306 | Tragic 63.4% |
| Central American Indians | 0.0 /100 | #307 | Tragic 63.4% |
| Pennsylvania Germans | 0.0 /100 | #308 | Tragic 63.4% |
| Scotch-Irish | 0.0 /100 | #309 | Tragic 63.3% |
| Shoshone | 0.0 /100 | #310 | Tragic 63.2% |
| Blackfeet | 0.0 /100 | #311 | Tragic 63.2% |
| Iroquois | 0.0 /100 | #312 | Tragic 63.2% |
| Chippewa | 0.0 /100 | #313 | Tragic 63.1% |
| Yaqui | 0.0 /100 | #314 | Tragic 63.0% |
| Potawatomi | 0.0 /100 | #315 | Tragic 62.8% |
| Yup'ik | 0.0 /100 | #316 | Tragic 62.7% |
| Kiowa | 0.0 /100 | #317 | Tragic 62.4% |