Potawatomi vs Immigrants from Greece In Labor Force | Age > 16
COMPARE
Potawatomi
Immigrants from Greece
In Labor Force | Age > 16
In Labor Force | Age > 16 Comparison
Potawatomi
Immigrants from Greece
62.8%
IN LABOR FORCE | AGE > 16
0.0/ 100
METRIC RATING
315th/ 347
METRIC RANK
65.0%
IN LABOR FORCE | AGE > 16
34.3/ 100
METRIC RATING
189th/ 347
METRIC RANK
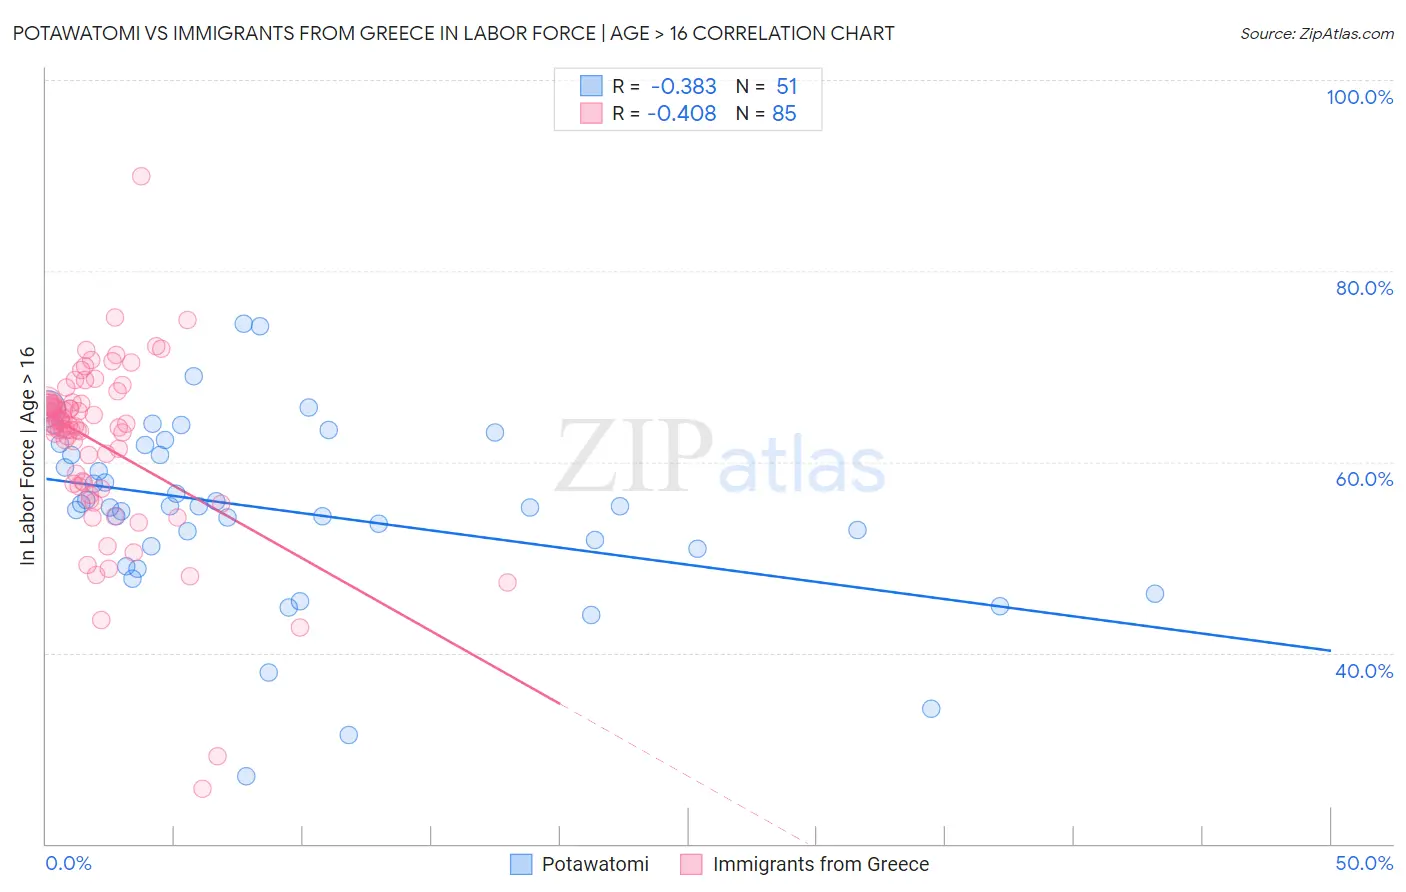
Potawatomi vs Immigrants from Greece In Labor Force | Age > 16 Correlation Chart
The statistical analysis conducted on geographies consisting of 117,774,216 people shows a mild negative correlation between the proportion of Potawatomi and labor force participation rate among population ages 16 and over in the United States with a correlation coefficient (R) of -0.383 and weighted average of 62.8%. Similarly, the statistical analysis conducted on geographies consisting of 216,877,956 people shows a moderate negative correlation between the proportion of Immigrants from Greece and labor force participation rate among population ages 16 and over in the United States with a correlation coefficient (R) of -0.408 and weighted average of 65.0%, a difference of 3.5%.
In Labor Force | Age > 16 Correlation Summary
| Measurement | Potawatomi | Immigrants from Greece |
| Minimum | 27.1% | 25.8% |
| Maximum | 74.5% | 89.9% |
| Range | 47.4% | 64.1% |
| Mean | 54.8% | 61.8% |
| Median | 55.3% | 63.8% |
| Interquartile 25% (IQ1) | 50.9% | 57.6% |
| Interquartile 75% (IQ3) | 61.7% | 66.2% |
| Interquartile Range (IQR) | 10.8% | 8.6% |
| Standard Deviation (Sample) | 9.5% | 9.2% |
| Standard Deviation (Population) | 9.4% | 9.2% |
Similar Demographics by In Labor Force | Age > 16
Demographics Similar to Potawatomi by In Labor Force | Age > 16
In terms of in labor force | age > 16, the demographic groups most similar to Potawatomi are Yup'ik (62.7%, a difference of 0.22%), Yaqui (63.0%, a difference of 0.35%), Chippewa (63.1%, a difference of 0.44%), Iroquois (63.2%, a difference of 0.57%), and Blackfeet (63.2%, a difference of 0.64%).
| Demographics | Rating | Rank | In Labor Force | Age > 16 |
| Pennsylvania Germans | 0.0 /100 | #308 | Tragic 63.4% |
| Scotch-Irish | 0.0 /100 | #309 | Tragic 63.3% |
| Shoshone | 0.0 /100 | #310 | Tragic 63.2% |
| Blackfeet | 0.0 /100 | #311 | Tragic 63.2% |
| Iroquois | 0.0 /100 | #312 | Tragic 63.2% |
| Chippewa | 0.0 /100 | #313 | Tragic 63.1% |
| Yaqui | 0.0 /100 | #314 | Tragic 63.0% |
| Potawatomi | 0.0 /100 | #315 | Tragic 62.8% |
| Yup'ik | 0.0 /100 | #316 | Tragic 62.7% |
| Kiowa | 0.0 /100 | #317 | Tragic 62.4% |
| Chickasaw | 0.0 /100 | #318 | Tragic 62.3% |
| Arapaho | 0.0 /100 | #319 | Tragic 62.1% |
| Yakama | 0.0 /100 | #320 | Tragic 62.1% |
| Americans | 0.0 /100 | #321 | Tragic 62.1% |
| Ottawa | 0.0 /100 | #322 | Tragic 62.0% |
Demographics Similar to Immigrants from Greece by In Labor Force | Age > 16
In terms of in labor force | age > 16, the demographic groups most similar to Immigrants from Greece are Barbadian (65.0%, a difference of 0.0%), Immigrants from Portugal (65.0%, a difference of 0.010%), Scandinavian (65.0%, a difference of 0.010%), Immigrants from Fiji (65.0%, a difference of 0.010%), and Immigrants from Europe (65.0%, a difference of 0.010%).
| Demographics | Rating | Rank | In Labor Force | Age > 16 |
| Immigrants | Nicaragua | 41.1 /100 | #182 | Average 65.1% |
| Soviet Union | 40.5 /100 | #183 | Average 65.0% |
| Carpatho Rusyns | 40.0 /100 | #184 | Average 65.0% |
| Syrians | 40.0 /100 | #185 | Average 65.0% |
| Immigrants | Switzerland | 38.2 /100 | #186 | Fair 65.0% |
| Immigrants | Croatia | 35.7 /100 | #187 | Fair 65.0% |
| Immigrants | Portugal | 34.8 /100 | #188 | Fair 65.0% |
| Immigrants | Greece | 34.3 /100 | #189 | Fair 65.0% |
| Barbadians | 33.9 /100 | #190 | Fair 65.0% |
| Scandinavians | 33.7 /100 | #191 | Fair 65.0% |
| Immigrants | Fiji | 33.7 /100 | #192 | Fair 65.0% |
| Immigrants | Europe | 33.6 /100 | #193 | Fair 65.0% |
| Immigrants | Southern Europe | 31.3 /100 | #194 | Fair 65.0% |
| Romanians | 31.1 /100 | #195 | Fair 65.0% |
| Haitians | 30.6 /100 | #196 | Fair 65.0% |