Armenian vs French Canadian In Labor Force | Age > 16
COMPARE
Armenian
French Canadian
In Labor Force | Age > 16
In Labor Force | Age > 16 Comparison
Armenians
French Canadians
64.9%
IN LABOR FORCE | AGE > 16
20.2/ 100
METRIC RATING
200th/ 347
METRIC RANK
64.0%
IN LABOR FORCE | AGE > 16
0.2/ 100
METRIC RATING
281st/ 347
METRIC RANK
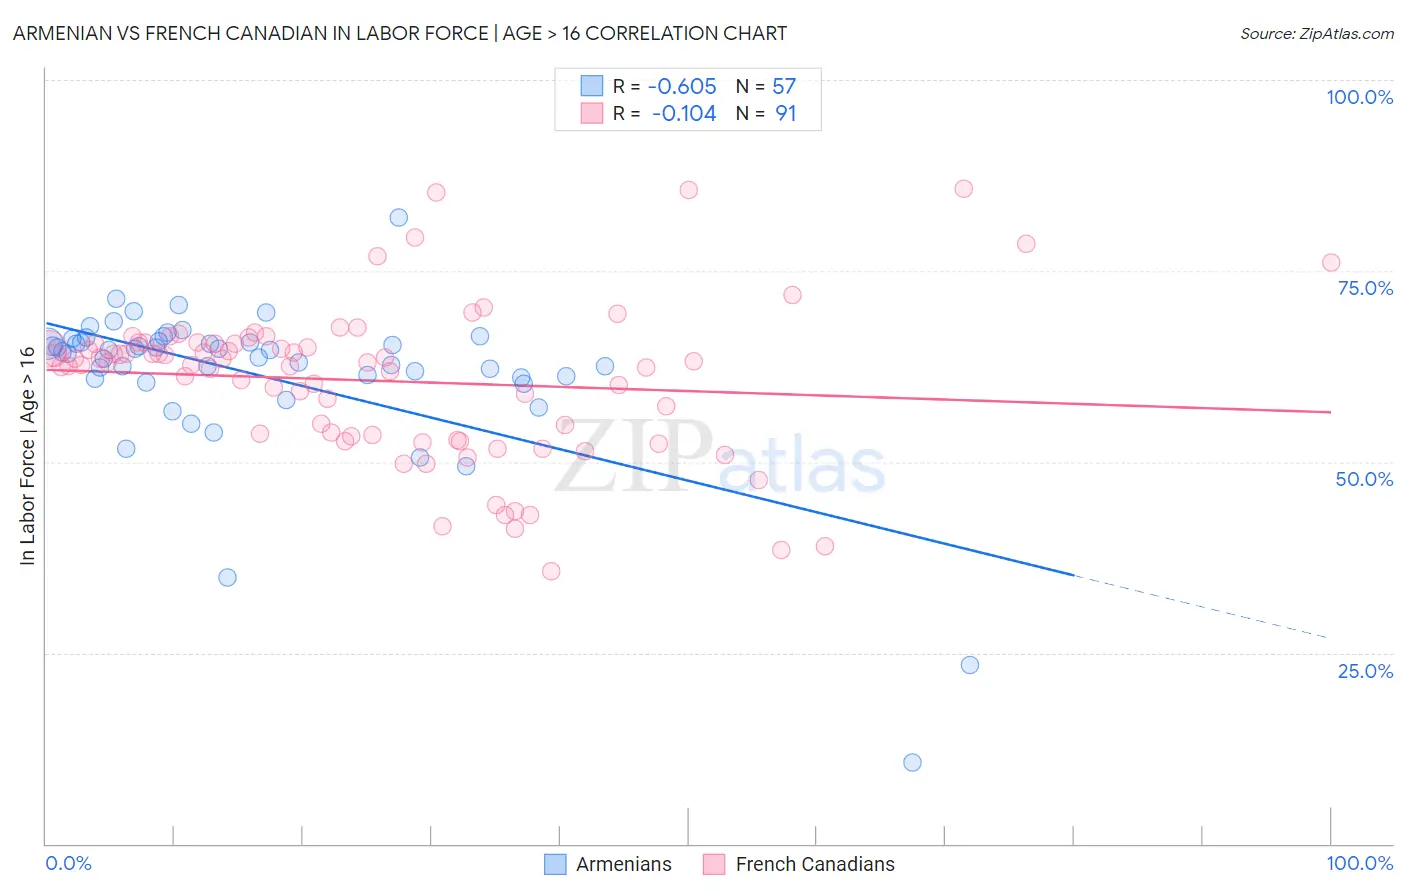
Armenian vs French Canadian In Labor Force | Age > 16 Correlation Chart
The statistical analysis conducted on geographies consisting of 310,962,108 people shows a significant negative correlation between the proportion of Armenians and labor force participation rate among population ages 16 and over in the United States with a correlation coefficient (R) of -0.605 and weighted average of 64.9%. Similarly, the statistical analysis conducted on geographies consisting of 502,679,464 people shows a poor negative correlation between the proportion of French Canadians and labor force participation rate among population ages 16 and over in the United States with a correlation coefficient (R) of -0.104 and weighted average of 64.0%, a difference of 1.3%.
In Labor Force | Age > 16 Correlation Summary
| Measurement | Armenian | French Canadian |
| Minimum | 10.6% | 35.7% |
| Maximum | 82.0% | 85.7% |
| Range | 71.4% | 50.0% |
| Mean | 61.4% | 60.6% |
| Median | 64.4% | 62.9% |
| Interquartile 25% (IQ1) | 60.9% | 53.4% |
| Interquartile 75% (IQ3) | 65.7% | 65.5% |
| Interquartile Range (IQR) | 4.8% | 12.1% |
| Standard Deviation (Sample) | 10.8% | 10.0% |
| Standard Deviation (Population) | 10.7% | 10.0% |
Similar Demographics by In Labor Force | Age > 16
Demographics Similar to Armenians by In Labor Force | Age > 16
In terms of in labor force | age > 16, the demographic groups most similar to Armenians are Ukrainian (64.9%, a difference of 0.010%), Immigrants from Belgium (64.9%, a difference of 0.020%), Russian (64.9%, a difference of 0.030%), Slovene (64.9%, a difference of 0.030%), and Jamaican (64.9%, a difference of 0.030%).
| Demographics | Rating | Rank | In Labor Force | Age > 16 |
| Immigrants | Europe | 33.6 /100 | #193 | Fair 65.0% |
| Immigrants | Southern Europe | 31.3 /100 | #194 | Fair 65.0% |
| Romanians | 31.1 /100 | #195 | Fair 65.0% |
| Haitians | 30.6 /100 | #196 | Fair 65.0% |
| Immigrants | Italy | 28.7 /100 | #197 | Fair 65.0% |
| Greeks | 26.1 /100 | #198 | Fair 64.9% |
| Mexican American Indians | 23.1 /100 | #199 | Fair 64.9% |
| Armenians | 20.2 /100 | #200 | Fair 64.9% |
| Ukrainians | 19.6 /100 | #201 | Poor 64.9% |
| Immigrants | Belgium | 19.4 /100 | #202 | Poor 64.9% |
| Russians | 18.8 /100 | #203 | Poor 64.9% |
| Slovenes | 18.7 /100 | #204 | Poor 64.9% |
| Jamaicans | 18.7 /100 | #205 | Poor 64.9% |
| Lithuanians | 17.4 /100 | #206 | Poor 64.8% |
| Immigrants | Latin America | 16.4 /100 | #207 | Poor 64.8% |
Demographics Similar to French Canadians by In Labor Force | Age > 16
In terms of in labor force | age > 16, the demographic groups most similar to French Canadians are Immigrants from St. Vincent and the Grenadines (64.0%, a difference of 0.0%), Welsh (64.0%, a difference of 0.010%), Assyrian/Chaldean/Syriac (64.0%, a difference of 0.040%), Immigrants from Bahamas (64.0%, a difference of 0.070%), and Immigrants from Guyana (64.0%, a difference of 0.080%).
| Demographics | Rating | Rank | In Labor Force | Age > 16 |
| Immigrants | Cuba | 0.3 /100 | #274 | Tragic 64.1% |
| Mexicans | 0.3 /100 | #275 | Tragic 64.1% |
| French American Indians | 0.3 /100 | #276 | Tragic 64.1% |
| Immigrants | Bahamas | 0.3 /100 | #277 | Tragic 64.0% |
| Assyrians/Chaldeans/Syriacs | 0.3 /100 | #278 | Tragic 64.0% |
| Welsh | 0.2 /100 | #279 | Tragic 64.0% |
| Immigrants | St. Vincent and the Grenadines | 0.2 /100 | #280 | Tragic 64.0% |
| French Canadians | 0.2 /100 | #281 | Tragic 64.0% |
| Immigrants | Guyana | 0.2 /100 | #282 | Tragic 64.0% |
| Immigrants | Germany | 0.1 /100 | #283 | Tragic 63.9% |
| French | 0.1 /100 | #284 | Tragic 63.9% |
| Slovaks | 0.1 /100 | #285 | Tragic 63.9% |
| Immigrants | Austria | 0.1 /100 | #286 | Tragic 63.9% |
| Scottish | 0.1 /100 | #287 | Tragic 63.9% |
| Spanish | 0.1 /100 | #288 | Tragic 63.9% |