Potawatomi vs Immigrants from Ecuador In Labor Force | Age > 16
COMPARE
Potawatomi
Immigrants from Ecuador
In Labor Force | Age > 16
In Labor Force | Age > 16 Comparison
Potawatomi
Immigrants from Ecuador
62.8%
IN LABOR FORCE | AGE > 16
0.0/ 100
METRIC RATING
315th/ 347
METRIC RANK
65.7%
IN LABOR FORCE | AGE > 16
95.9/ 100
METRIC RATING
122nd/ 347
METRIC RANK
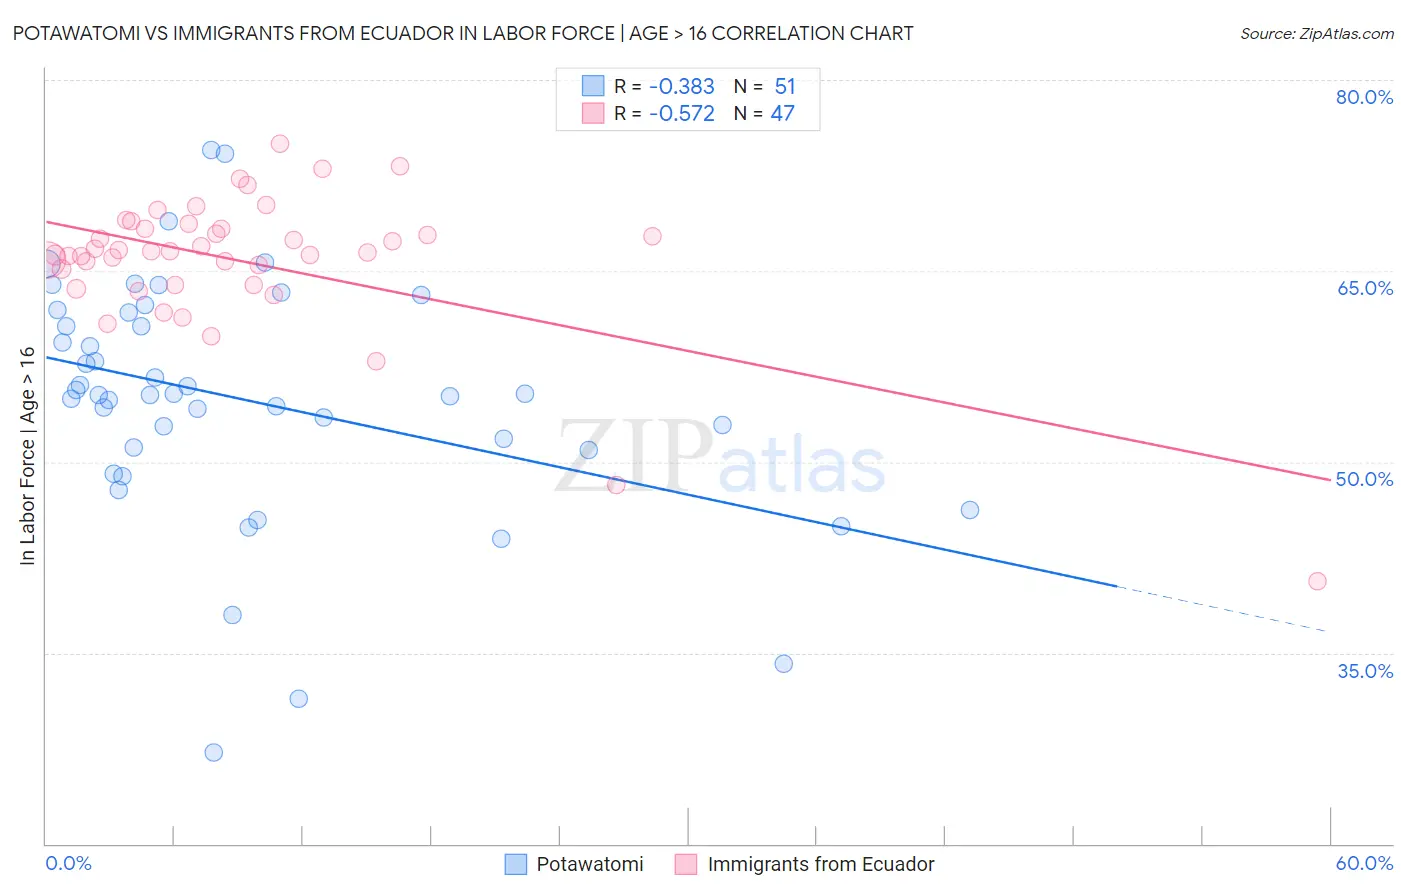
Potawatomi vs Immigrants from Ecuador In Labor Force | Age > 16 Correlation Chart
The statistical analysis conducted on geographies consisting of 117,774,216 people shows a mild negative correlation between the proportion of Potawatomi and labor force participation rate among population ages 16 and over in the United States with a correlation coefficient (R) of -0.383 and weighted average of 62.8%. Similarly, the statistical analysis conducted on geographies consisting of 271,016,720 people shows a substantial negative correlation between the proportion of Immigrants from Ecuador and labor force participation rate among population ages 16 and over in the United States with a correlation coefficient (R) of -0.572 and weighted average of 65.7%, a difference of 4.6%.
In Labor Force | Age > 16 Correlation Summary
| Measurement | Potawatomi | Immigrants from Ecuador |
| Minimum | 27.1% | 40.6% |
| Maximum | 74.5% | 75.0% |
| Range | 47.4% | 34.4% |
| Mean | 54.8% | 65.8% |
| Median | 55.3% | 66.6% |
| Interquartile 25% (IQ1) | 50.9% | 63.9% |
| Interquartile 75% (IQ3) | 61.7% | 68.4% |
| Interquartile Range (IQR) | 10.8% | 4.4% |
| Standard Deviation (Sample) | 9.5% | 5.7% |
| Standard Deviation (Population) | 9.4% | 5.7% |
Similar Demographics by In Labor Force | Age > 16
Demographics Similar to Potawatomi by In Labor Force | Age > 16
In terms of in labor force | age > 16, the demographic groups most similar to Potawatomi are Yup'ik (62.7%, a difference of 0.22%), Yaqui (63.0%, a difference of 0.35%), Chippewa (63.1%, a difference of 0.44%), Iroquois (63.2%, a difference of 0.57%), and Blackfeet (63.2%, a difference of 0.64%).
| Demographics | Rating | Rank | In Labor Force | Age > 16 |
| Pennsylvania Germans | 0.0 /100 | #308 | Tragic 63.4% |
| Scotch-Irish | 0.0 /100 | #309 | Tragic 63.3% |
| Shoshone | 0.0 /100 | #310 | Tragic 63.2% |
| Blackfeet | 0.0 /100 | #311 | Tragic 63.2% |
| Iroquois | 0.0 /100 | #312 | Tragic 63.2% |
| Chippewa | 0.0 /100 | #313 | Tragic 63.1% |
| Yaqui | 0.0 /100 | #314 | Tragic 63.0% |
| Potawatomi | 0.0 /100 | #315 | Tragic 62.8% |
| Yup'ik | 0.0 /100 | #316 | Tragic 62.7% |
| Kiowa | 0.0 /100 | #317 | Tragic 62.4% |
| Chickasaw | 0.0 /100 | #318 | Tragic 62.3% |
| Arapaho | 0.0 /100 | #319 | Tragic 62.1% |
| Yakama | 0.0 /100 | #320 | Tragic 62.1% |
| Americans | 0.0 /100 | #321 | Tragic 62.1% |
| Ottawa | 0.0 /100 | #322 | Tragic 62.0% |
Demographics Similar to Immigrants from Ecuador by In Labor Force | Age > 16
In terms of in labor force | age > 16, the demographic groups most similar to Immigrants from Ecuador are New Zealander (65.7%, a difference of 0.010%), Immigrants from Hong Kong (65.7%, a difference of 0.020%), Immigrants from Iraq (65.7%, a difference of 0.030%), Iraqi (65.7%, a difference of 0.030%), and Immigrants from France (65.7%, a difference of 0.040%).
| Demographics | Rating | Rank | In Labor Force | Age > 16 |
| Immigrants | Indonesia | 96.8 /100 | #115 | Exceptional 65.7% |
| Argentineans | 96.7 /100 | #116 | Exceptional 65.7% |
| Immigrants | Iran | 96.6 /100 | #117 | Exceptional 65.7% |
| Immigrants | Thailand | 96.6 /100 | #118 | Exceptional 65.7% |
| Immigrants | France | 96.4 /100 | #119 | Exceptional 65.7% |
| Immigrants | Hong Kong | 96.2 /100 | #120 | Exceptional 65.7% |
| New Zealanders | 96.0 /100 | #121 | Exceptional 65.7% |
| Immigrants | Ecuador | 95.9 /100 | #122 | Exceptional 65.7% |
| Immigrants | Iraq | 95.5 /100 | #123 | Exceptional 65.7% |
| Iraqis | 95.4 /100 | #124 | Exceptional 65.7% |
| Norwegians | 95.3 /100 | #125 | Exceptional 65.7% |
| Koreans | 95.3 /100 | #126 | Exceptional 65.7% |
| Immigrants | Eastern Asia | 94.9 /100 | #127 | Exceptional 65.7% |
| Ecuadorians | 94.7 /100 | #128 | Exceptional 65.6% |
| Immigrants | Philippines | 94.5 /100 | #129 | Exceptional 65.6% |