Alaska Native vs French Canadian In Labor Force | Age > 16
COMPARE
Alaska Native
French Canadian
In Labor Force | Age > 16
In Labor Force | Age > 16 Comparison
Alaska Natives
French Canadians
64.7%
IN LABOR FORCE | AGE > 16
9.9/ 100
METRIC RATING
220th/ 347
METRIC RANK
64.0%
IN LABOR FORCE | AGE > 16
0.2/ 100
METRIC RATING
281st/ 347
METRIC RANK
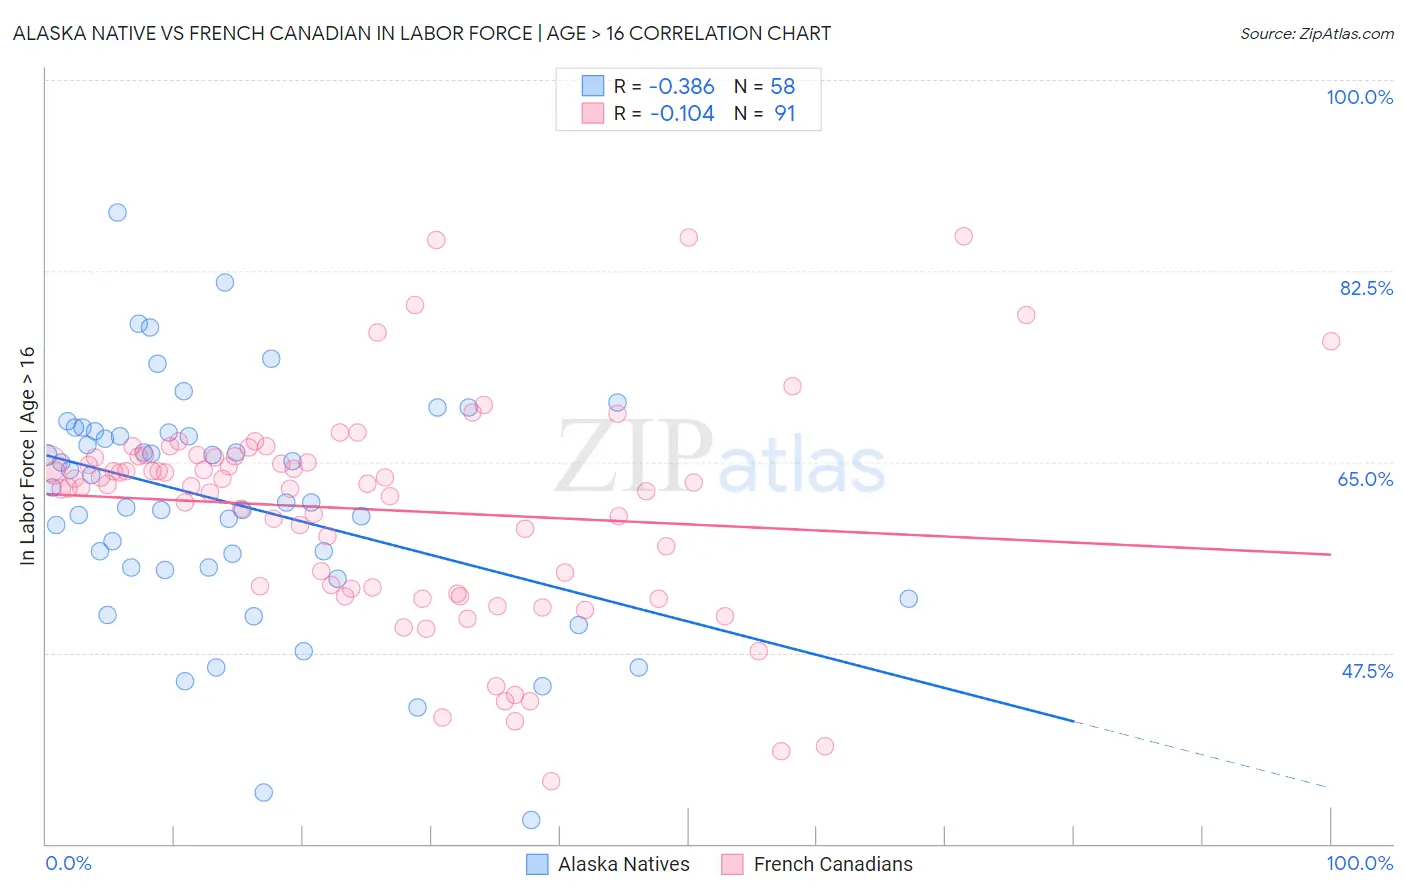
Alaska Native vs French Canadian In Labor Force | Age > 16 Correlation Chart
The statistical analysis conducted on geographies consisting of 76,778,571 people shows a mild negative correlation between the proportion of Alaska Natives and labor force participation rate among population ages 16 and over in the United States with a correlation coefficient (R) of -0.386 and weighted average of 64.7%. Similarly, the statistical analysis conducted on geographies consisting of 502,679,464 people shows a poor negative correlation between the proportion of French Canadians and labor force participation rate among population ages 16 and over in the United States with a correlation coefficient (R) of -0.104 and weighted average of 64.0%, a difference of 1.1%.
In Labor Force | Age > 16 Correlation Summary
| Measurement | Alaska Native | French Canadian |
| Minimum | 32.2% | 35.7% |
| Maximum | 87.9% | 85.7% |
| Range | 55.7% | 50.0% |
| Mean | 61.2% | 60.6% |
| Median | 62.0% | 62.9% |
| Interquartile 25% (IQ1) | 55.3% | 53.4% |
| Interquartile 75% (IQ3) | 67.7% | 65.5% |
| Interquartile Range (IQR) | 12.4% | 12.1% |
| Standard Deviation (Sample) | 10.7% | 10.0% |
| Standard Deviation (Population) | 10.7% | 10.0% |
Similar Demographics by In Labor Force | Age > 16
Demographics Similar to Alaska Natives by In Labor Force | Age > 16
In terms of in labor force | age > 16, the demographic groups most similar to Alaska Natives are Immigrants from Micronesia (64.7%, a difference of 0.010%), Immigrants from Central America (64.7%, a difference of 0.020%), Hawaiian (64.7%, a difference of 0.020%), Immigrants from Belize (64.7%, a difference of 0.020%), and Alsatian (64.7%, a difference of 0.030%).
| Demographics | Rating | Rank | In Labor Force | Age > 16 |
| Maltese | 13.8 /100 | #213 | Poor 64.8% |
| Estonians | 13.1 /100 | #214 | Poor 64.8% |
| Immigrants | Czechoslovakia | 12.3 /100 | #215 | Poor 64.8% |
| Belgians | 11.4 /100 | #216 | Poor 64.7% |
| U.S. Virgin Islanders | 11.3 /100 | #217 | Poor 64.7% |
| Alsatians | 10.7 /100 | #218 | Poor 64.7% |
| Immigrants | Central America | 10.5 /100 | #219 | Poor 64.7% |
| Alaska Natives | 9.9 /100 | #220 | Tragic 64.7% |
| Immigrants | Micronesia | 9.6 /100 | #221 | Tragic 64.7% |
| Hawaiians | 9.3 /100 | #222 | Tragic 64.7% |
| Immigrants | Belize | 9.2 /100 | #223 | Tragic 64.7% |
| Immigrants | Jamaica | 8.8 /100 | #224 | Tragic 64.7% |
| Croatians | 8.8 /100 | #225 | Tragic 64.7% |
| Europeans | 8.3 /100 | #226 | Tragic 64.7% |
| Poles | 8.3 /100 | #227 | Tragic 64.7% |
Demographics Similar to French Canadians by In Labor Force | Age > 16
In terms of in labor force | age > 16, the demographic groups most similar to French Canadians are Immigrants from St. Vincent and the Grenadines (64.0%, a difference of 0.0%), Welsh (64.0%, a difference of 0.010%), Assyrian/Chaldean/Syriac (64.0%, a difference of 0.040%), Immigrants from Bahamas (64.0%, a difference of 0.070%), and Immigrants from Guyana (64.0%, a difference of 0.080%).
| Demographics | Rating | Rank | In Labor Force | Age > 16 |
| Immigrants | Cuba | 0.3 /100 | #274 | Tragic 64.1% |
| Mexicans | 0.3 /100 | #275 | Tragic 64.1% |
| French American Indians | 0.3 /100 | #276 | Tragic 64.1% |
| Immigrants | Bahamas | 0.3 /100 | #277 | Tragic 64.0% |
| Assyrians/Chaldeans/Syriacs | 0.3 /100 | #278 | Tragic 64.0% |
| Welsh | 0.2 /100 | #279 | Tragic 64.0% |
| Immigrants | St. Vincent and the Grenadines | 0.2 /100 | #280 | Tragic 64.0% |
| French Canadians | 0.2 /100 | #281 | Tragic 64.0% |
| Immigrants | Guyana | 0.2 /100 | #282 | Tragic 64.0% |
| Immigrants | Germany | 0.1 /100 | #283 | Tragic 63.9% |
| French | 0.1 /100 | #284 | Tragic 63.9% |
| Slovaks | 0.1 /100 | #285 | Tragic 63.9% |
| Immigrants | Austria | 0.1 /100 | #286 | Tragic 63.9% |
| Scottish | 0.1 /100 | #287 | Tragic 63.9% |
| Spanish | 0.1 /100 | #288 | Tragic 63.9% |