Sri Lankan vs French Canadian In Labor Force | Age > 16
COMPARE
Sri Lankan
French Canadian
In Labor Force | Age > 16
In Labor Force | Age > 16 Comparison
Sri Lankans
French Canadians
66.3%
IN LABOR FORCE | AGE > 16
99.8/ 100
METRIC RATING
65th/ 347
METRIC RANK
64.0%
IN LABOR FORCE | AGE > 16
0.2/ 100
METRIC RATING
281st/ 347
METRIC RANK
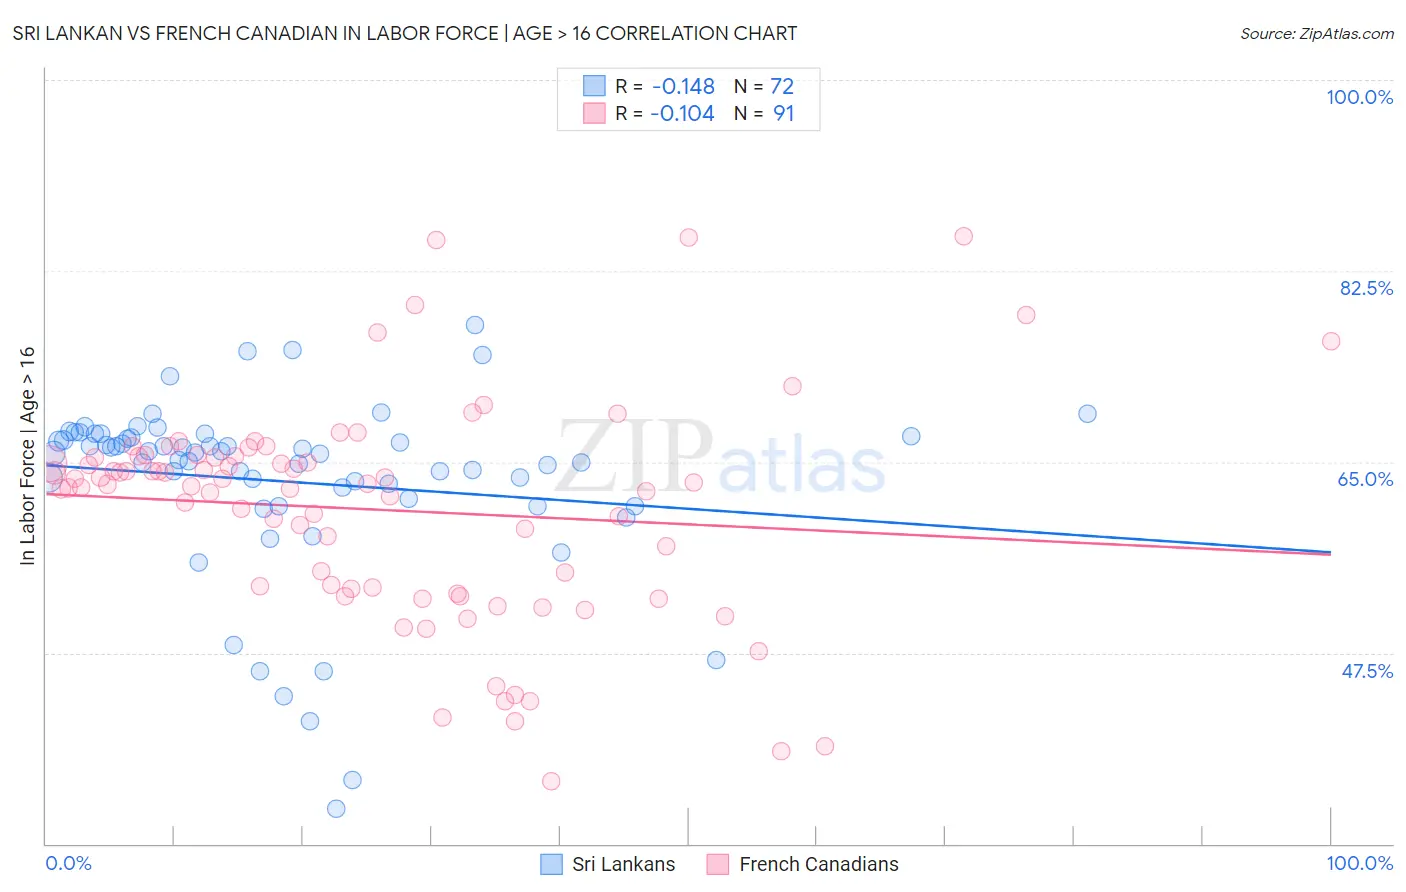
Sri Lankan vs French Canadian In Labor Force | Age > 16 Correlation Chart
The statistical analysis conducted on geographies consisting of 440,615,850 people shows a poor negative correlation between the proportion of Sri Lankans and labor force participation rate among population ages 16 and over in the United States with a correlation coefficient (R) of -0.148 and weighted average of 66.3%. Similarly, the statistical analysis conducted on geographies consisting of 502,679,464 people shows a poor negative correlation between the proportion of French Canadians and labor force participation rate among population ages 16 and over in the United States with a correlation coefficient (R) of -0.104 and weighted average of 64.0%, a difference of 3.5%.
In Labor Force | Age > 16 Correlation Summary
| Measurement | Sri Lankan | French Canadian |
| Minimum | 33.2% | 35.7% |
| Maximum | 77.6% | 85.7% |
| Range | 44.4% | 50.0% |
| Mean | 63.2% | 60.6% |
| Median | 65.8% | 62.9% |
| Interquartile 25% (IQ1) | 62.1% | 53.4% |
| Interquartile 75% (IQ3) | 67.2% | 65.5% |
| Interquartile Range (IQR) | 5.1% | 12.1% |
| Standard Deviation (Sample) | 8.5% | 10.0% |
| Standard Deviation (Population) | 8.4% | 10.0% |
Similar Demographics by In Labor Force | Age > 16
Demographics Similar to Sri Lankans by In Labor Force | Age > 16
In terms of in labor force | age > 16, the demographic groups most similar to Sri Lankans are Venezuelan (66.3%, a difference of 0.010%), Peruvian (66.3%, a difference of 0.010%), Jordanian (66.3%, a difference of 0.020%), Immigrants from Peru (66.3%, a difference of 0.050%), and Immigrants from Burma/Myanmar (66.3%, a difference of 0.050%).
| Demographics | Rating | Rank | In Labor Force | Age > 16 |
| Immigrants | Saudi Arabia | 99.9 /100 | #58 | Exceptional 66.3% |
| Immigrants | Turkey | 99.9 /100 | #59 | Exceptional 66.3% |
| Immigrants | Peru | 99.8 /100 | #60 | Exceptional 66.3% |
| Immigrants | Burma/Myanmar | 99.8 /100 | #61 | Exceptional 66.3% |
| Indonesians | 99.8 /100 | #62 | Exceptional 66.3% |
| Venezuelans | 99.8 /100 | #63 | Exceptional 66.3% |
| Peruvians | 99.8 /100 | #64 | Exceptional 66.3% |
| Sri Lankans | 99.8 /100 | #65 | Exceptional 66.3% |
| Jordanians | 99.8 /100 | #66 | Exceptional 66.3% |
| Egyptians | 99.8 /100 | #67 | Exceptional 66.2% |
| Immigrants | Egypt | 99.7 /100 | #68 | Exceptional 66.2% |
| Sub-Saharan Africans | 99.7 /100 | #69 | Exceptional 66.2% |
| Asians | 99.7 /100 | #70 | Exceptional 66.2% |
| Burmese | 99.7 /100 | #71 | Exceptional 66.2% |
| Taiwanese | 99.7 /100 | #72 | Exceptional 66.2% |
Demographics Similar to French Canadians by In Labor Force | Age > 16
In terms of in labor force | age > 16, the demographic groups most similar to French Canadians are Immigrants from St. Vincent and the Grenadines (64.0%, a difference of 0.0%), Welsh (64.0%, a difference of 0.010%), Assyrian/Chaldean/Syriac (64.0%, a difference of 0.040%), Immigrants from Bahamas (64.0%, a difference of 0.070%), and Immigrants from Guyana (64.0%, a difference of 0.080%).
| Demographics | Rating | Rank | In Labor Force | Age > 16 |
| Immigrants | Cuba | 0.3 /100 | #274 | Tragic 64.1% |
| Mexicans | 0.3 /100 | #275 | Tragic 64.1% |
| French American Indians | 0.3 /100 | #276 | Tragic 64.1% |
| Immigrants | Bahamas | 0.3 /100 | #277 | Tragic 64.0% |
| Assyrians/Chaldeans/Syriacs | 0.3 /100 | #278 | Tragic 64.0% |
| Welsh | 0.2 /100 | #279 | Tragic 64.0% |
| Immigrants | St. Vincent and the Grenadines | 0.2 /100 | #280 | Tragic 64.0% |
| French Canadians | 0.2 /100 | #281 | Tragic 64.0% |
| Immigrants | Guyana | 0.2 /100 | #282 | Tragic 64.0% |
| Immigrants | Germany | 0.1 /100 | #283 | Tragic 63.9% |
| French | 0.1 /100 | #284 | Tragic 63.9% |
| Slovaks | 0.1 /100 | #285 | Tragic 63.9% |
| Immigrants | Austria | 0.1 /100 | #286 | Tragic 63.9% |
| Scottish | 0.1 /100 | #287 | Tragic 63.9% |
| Spanish | 0.1 /100 | #288 | Tragic 63.9% |