Potawatomi vs Immigrants from England In Labor Force | Age > 16
COMPARE
Potawatomi
Immigrants from England
In Labor Force | Age > 16
In Labor Force | Age > 16 Comparison
Potawatomi
Immigrants from England
62.8%
IN LABOR FORCE | AGE > 16
0.0/ 100
METRIC RATING
315th/ 347
METRIC RANK
64.2%
IN LABOR FORCE | AGE > 16
0.5/ 100
METRIC RATING
266th/ 347
METRIC RANK
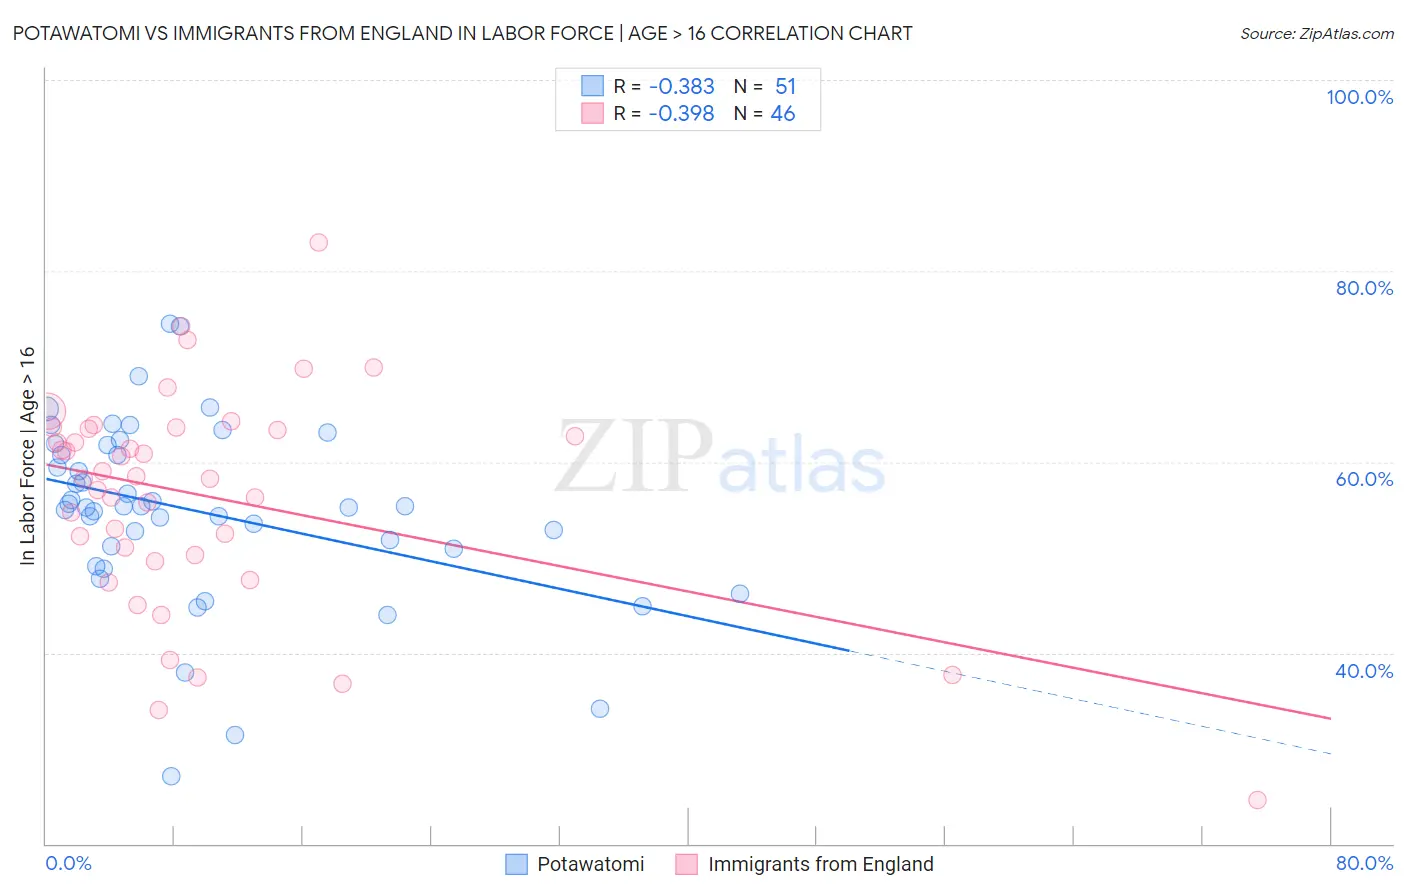
Potawatomi vs Immigrants from England In Labor Force | Age > 16 Correlation Chart
The statistical analysis conducted on geographies consisting of 117,774,216 people shows a mild negative correlation between the proportion of Potawatomi and labor force participation rate among population ages 16 and over in the United States with a correlation coefficient (R) of -0.383 and weighted average of 62.8%. Similarly, the statistical analysis conducted on geographies consisting of 391,897,781 people shows a mild negative correlation between the proportion of Immigrants from England and labor force participation rate among population ages 16 and over in the United States with a correlation coefficient (R) of -0.398 and weighted average of 64.2%, a difference of 2.1%.
In Labor Force | Age > 16 Correlation Summary
| Measurement | Potawatomi | Immigrants from England |
| Minimum | 27.1% | 24.6% |
| Maximum | 74.5% | 83.0% |
| Range | 47.4% | 58.4% |
| Mean | 54.8% | 56.4% |
| Median | 55.3% | 58.3% |
| Interquartile 25% (IQ1) | 50.9% | 50.2% |
| Interquartile 75% (IQ3) | 61.7% | 63.5% |
| Interquartile Range (IQR) | 10.8% | 13.3% |
| Standard Deviation (Sample) | 9.5% | 11.5% |
| Standard Deviation (Population) | 9.4% | 11.3% |
Similar Demographics by In Labor Force | Age > 16
Demographics Similar to Potawatomi by In Labor Force | Age > 16
In terms of in labor force | age > 16, the demographic groups most similar to Potawatomi are Yup'ik (62.7%, a difference of 0.22%), Yaqui (63.0%, a difference of 0.35%), Chippewa (63.1%, a difference of 0.44%), Iroquois (63.2%, a difference of 0.57%), and Blackfeet (63.2%, a difference of 0.64%).
| Demographics | Rating | Rank | In Labor Force | Age > 16 |
| Pennsylvania Germans | 0.0 /100 | #308 | Tragic 63.4% |
| Scotch-Irish | 0.0 /100 | #309 | Tragic 63.3% |
| Shoshone | 0.0 /100 | #310 | Tragic 63.2% |
| Blackfeet | 0.0 /100 | #311 | Tragic 63.2% |
| Iroquois | 0.0 /100 | #312 | Tragic 63.2% |
| Chippewa | 0.0 /100 | #313 | Tragic 63.1% |
| Yaqui | 0.0 /100 | #314 | Tragic 63.0% |
| Potawatomi | 0.0 /100 | #315 | Tragic 62.8% |
| Yup'ik | 0.0 /100 | #316 | Tragic 62.7% |
| Kiowa | 0.0 /100 | #317 | Tragic 62.4% |
| Chickasaw | 0.0 /100 | #318 | Tragic 62.3% |
| Arapaho | 0.0 /100 | #319 | Tragic 62.1% |
| Yakama | 0.0 /100 | #320 | Tragic 62.1% |
| Americans | 0.0 /100 | #321 | Tragic 62.1% |
| Ottawa | 0.0 /100 | #322 | Tragic 62.0% |
Demographics Similar to Immigrants from England by In Labor Force | Age > 16
In terms of in labor force | age > 16, the demographic groups most similar to Immigrants from England are Cuban (64.2%, a difference of 0.010%), Canadian (64.1%, a difference of 0.010%), Spaniard (64.1%, a difference of 0.010%), Dutch (64.2%, a difference of 0.050%), and Irish (64.1%, a difference of 0.050%).
| Demographics | Rating | Rank | In Labor Force | Age > 16 |
| Immigrants | Western Europe | 0.7 /100 | #259 | Tragic 64.2% |
| Marshallese | 0.7 /100 | #260 | Tragic 64.2% |
| Basques | 0.7 /100 | #261 | Tragic 64.2% |
| Finns | 0.7 /100 | #262 | Tragic 64.2% |
| Bahamians | 0.6 /100 | #263 | Tragic 64.2% |
| Dutch | 0.6 /100 | #264 | Tragic 64.2% |
| Cubans | 0.5 /100 | #265 | Tragic 64.2% |
| Immigrants | England | 0.5 /100 | #266 | Tragic 64.2% |
| Canadians | 0.5 /100 | #267 | Tragic 64.1% |
| Spaniards | 0.5 /100 | #268 | Tragic 64.1% |
| Irish | 0.4 /100 | #269 | Tragic 64.1% |
| Guyanese | 0.4 /100 | #270 | Tragic 64.1% |
| Dominicans | 0.4 /100 | #271 | Tragic 64.1% |
| Native Hawaiians | 0.3 /100 | #272 | Tragic 64.1% |
| Hmong | 0.3 /100 | #273 | Tragic 64.1% |