Pima vs Australian In Labor Force | Age 20-64
COMPARE
Pima
Australian
In Labor Force | Age 20-64
In Labor Force | Age 20-64 Comparison
Pima
Australians
69.0%
IN LABOR FORCE | AGE 20-64
0.0/ 100
METRIC RATING
347th/ 347
METRIC RANK
79.5%
IN LABOR FORCE | AGE 20-64
46.0/ 100
METRIC RATING
176th/ 347
METRIC RANK
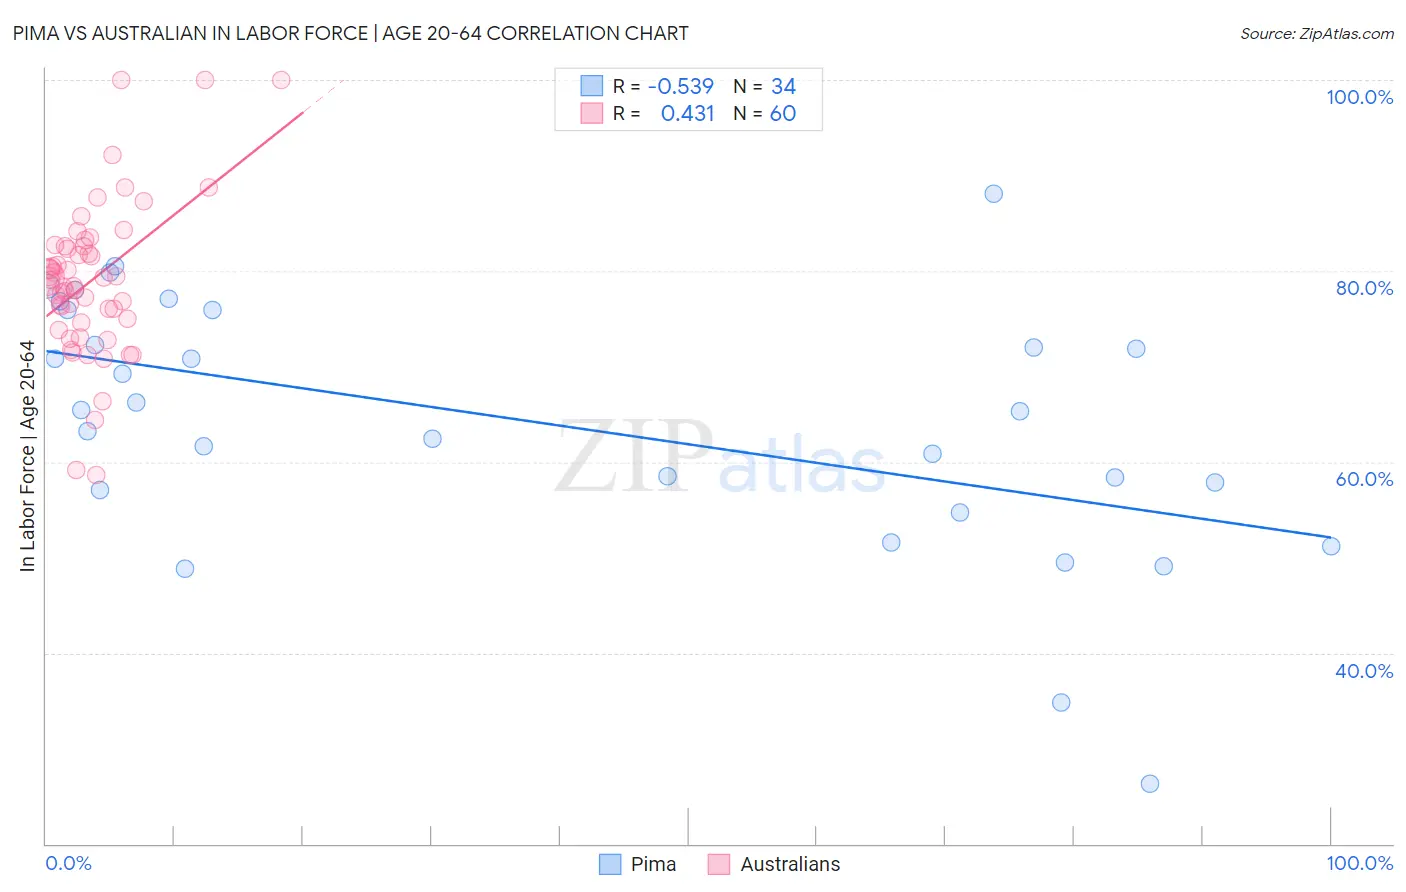
Pima vs Australian In Labor Force | Age 20-64 Correlation Chart
The statistical analysis conducted on geographies consisting of 61,542,645 people shows a substantial negative correlation between the proportion of Pima and labor force participation rate among population between the ages 20 and 64 in the United States with a correlation coefficient (R) of -0.539 and weighted average of 69.0%. Similarly, the statistical analysis conducted on geographies consisting of 224,163,078 people shows a moderate positive correlation between the proportion of Australians and labor force participation rate among population between the ages 20 and 64 in the United States with a correlation coefficient (R) of 0.431 and weighted average of 79.5%, a difference of 15.2%.
In Labor Force | Age 20-64 Correlation Summary
| Measurement | Pima | Australian |
| Minimum | 26.3% | 58.6% |
| Maximum | 88.1% | 100.0% |
| Range | 61.8% | 41.4% |
| Mean | 64.1% | 79.0% |
| Median | 65.3% | 79.2% |
| Interquartile 25% (IQ1) | 57.1% | 74.8% |
| Interquartile 75% (IQ3) | 75.9% | 82.6% |
| Interquartile Range (IQR) | 18.8% | 7.8% |
| Standard Deviation (Sample) | 13.4% | 8.0% |
| Standard Deviation (Population) | 13.2% | 8.0% |
Similar Demographics by In Labor Force | Age 20-64
Demographics Similar to Pima by In Labor Force | Age 20-64
In terms of in labor force | age 20-64, the demographic groups most similar to Pima are Navajo (69.2%, a difference of 0.16%), Tohono O'odham (70.4%, a difference of 2.0%), Lumbee (70.6%, a difference of 2.3%), Hopi (71.7%, a difference of 3.9%), and Yuman (71.7%, a difference of 3.9%).
| Demographics | Rating | Rank | In Labor Force | Age 20-64 |
| Natives/Alaskans | 0.0 /100 | #333 | Tragic 73.9% |
| Apache | 0.0 /100 | #334 | Tragic 73.7% |
| Ute | 0.0 /100 | #335 | Tragic 73.7% |
| Crow | 0.0 /100 | #336 | Tragic 73.3% |
| Yup'ik | 0.0 /100 | #337 | Tragic 73.2% |
| Puerto Ricans | 0.0 /100 | #338 | Tragic 73.1% |
| Houma | 0.0 /100 | #339 | Tragic 72.7% |
| Pueblo | 0.0 /100 | #340 | Tragic 72.6% |
| Immigrants | Yemen | 0.0 /100 | #341 | Tragic 72.3% |
| Yuman | 0.0 /100 | #342 | Tragic 71.7% |
| Hopi | 0.0 /100 | #343 | Tragic 71.7% |
| Lumbee | 0.0 /100 | #344 | Tragic 70.6% |
| Tohono O'odham | 0.0 /100 | #345 | Tragic 70.4% |
| Navajo | 0.0 /100 | #346 | Tragic 69.2% |
| Pima | 0.0 /100 | #347 | Tragic 69.0% |
Demographics Similar to Australians by In Labor Force | Age 20-64
In terms of in labor force | age 20-64, the demographic groups most similar to Australians are Cuban (79.5%, a difference of 0.0%), Immigrants from Netherlands (79.5%, a difference of 0.010%), Czechoslovakian (79.5%, a difference of 0.010%), Syrian (79.6%, a difference of 0.030%), and Armenian (79.5%, a difference of 0.040%).
| Demographics | Rating | Rank | In Labor Force | Age 20-64 |
| Laotians | 58.4 /100 | #169 | Average 79.6% |
| Slavs | 54.0 /100 | #170 | Average 79.6% |
| Immigrants | Switzerland | 53.3 /100 | #171 | Average 79.6% |
| Immigrants | Belgium | 53.1 /100 | #172 | Average 79.6% |
| Immigrants | Scotland | 52.4 /100 | #173 | Average 79.6% |
| Syrians | 50.0 /100 | #174 | Average 79.6% |
| Cubans | 46.1 /100 | #175 | Average 79.5% |
| Australians | 46.0 /100 | #176 | Average 79.5% |
| Immigrants | Netherlands | 45.2 /100 | #177 | Average 79.5% |
| Czechoslovakians | 44.3 /100 | #178 | Average 79.5% |
| Armenians | 41.4 /100 | #179 | Average 79.5% |
| Salvadorans | 41.0 /100 | #180 | Average 79.5% |
| Immigrants | Saudi Arabia | 37.7 /100 | #181 | Fair 79.5% |
| Malaysians | 37.1 /100 | #182 | Fair 79.5% |
| Immigrants | Hungary | 36.8 /100 | #183 | Fair 79.5% |