Immigrants from Italy vs Australian In Labor Force | Age 20-64
COMPARE
Immigrants from Italy
Australian
In Labor Force | Age 20-64
In Labor Force | Age 20-64 Comparison
Immigrants from Italy
Australians
80.0%
IN LABOR FORCE | AGE 20-64
93.9/ 100
METRIC RATING
112th/ 347
METRIC RANK
79.5%
IN LABOR FORCE | AGE 20-64
46.0/ 100
METRIC RATING
176th/ 347
METRIC RANK
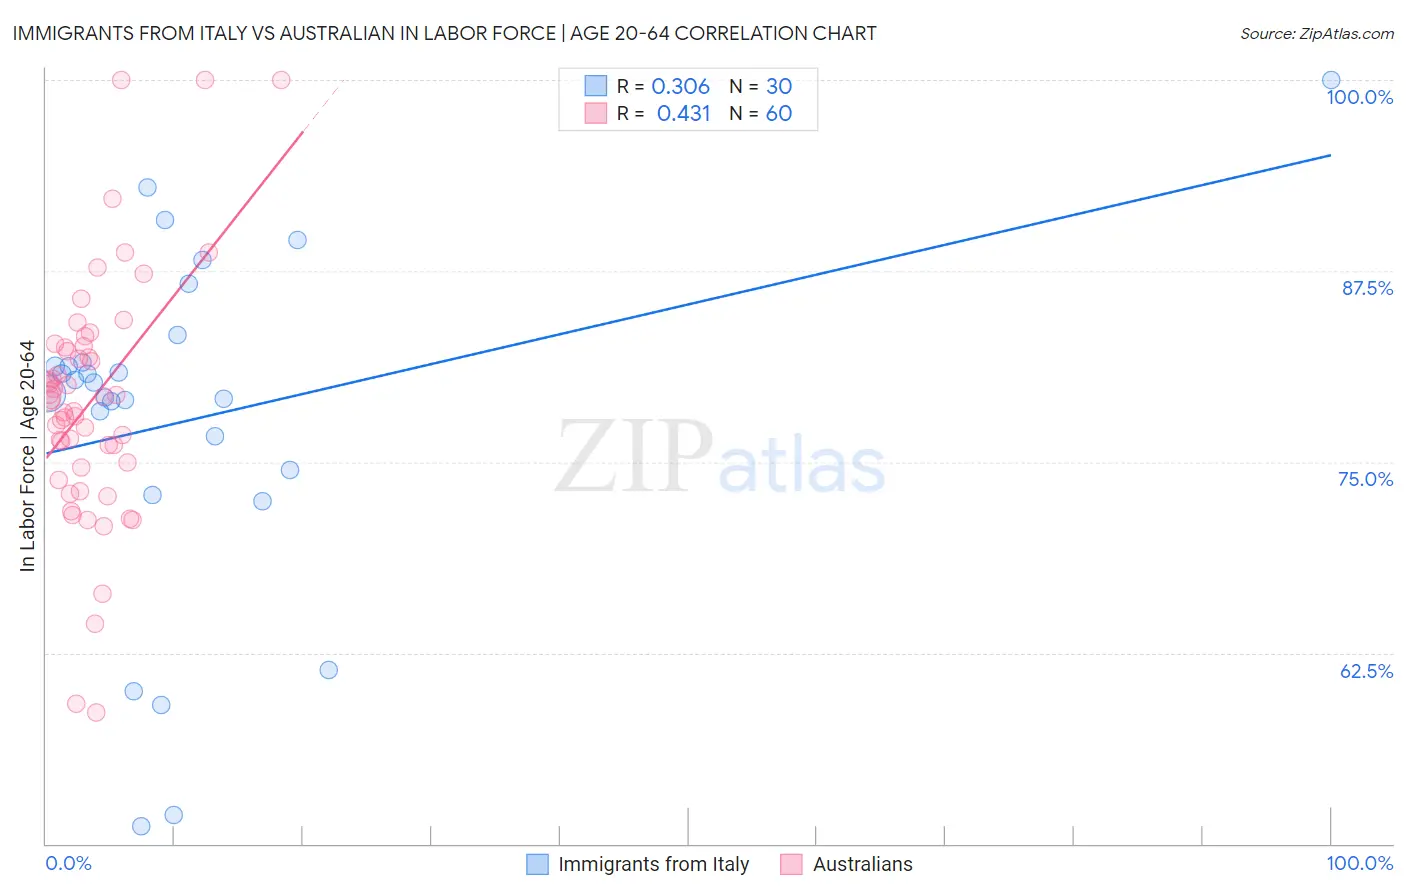
Immigrants from Italy vs Australian In Labor Force | Age 20-64 Correlation Chart
The statistical analysis conducted on geographies consisting of 324,217,381 people shows a mild positive correlation between the proportion of Immigrants from Italy and labor force participation rate among population between the ages 20 and 64 in the United States with a correlation coefficient (R) of 0.306 and weighted average of 80.0%. Similarly, the statistical analysis conducted on geographies consisting of 224,163,078 people shows a moderate positive correlation between the proportion of Australians and labor force participation rate among population between the ages 20 and 64 in the United States with a correlation coefficient (R) of 0.431 and weighted average of 79.5%, a difference of 0.58%.
In Labor Force | Age 20-64 Correlation Summary
| Measurement | Immigrants from Italy | Australian |
| Minimum | 51.2% | 58.6% |
| Maximum | 100.0% | 100.0% |
| Range | 48.8% | 41.4% |
| Mean | 77.8% | 79.0% |
| Median | 79.8% | 79.2% |
| Interquartile 25% (IQ1) | 74.5% | 74.8% |
| Interquartile 75% (IQ3) | 81.5% | 82.6% |
| Interquartile Range (IQR) | 7.0% | 7.8% |
| Standard Deviation (Sample) | 11.3% | 8.0% |
| Standard Deviation (Population) | 11.1% | 8.0% |
Similar Demographics by In Labor Force | Age 20-64
Demographics Similar to Immigrants from Italy by In Labor Force | Age 20-64
In terms of in labor force | age 20-64, the demographic groups most similar to Immigrants from Italy are Estonian (80.0%, a difference of 0.0%), Immigrants from South America (80.0%, a difference of 0.0%), Sri Lankan (80.0%, a difference of 0.0%), Argentinean (80.0%, a difference of 0.0%), and Iranian (80.0%, a difference of 0.010%).
| Demographics | Rating | Rank | In Labor Force | Age 20-64 |
| Immigrants | Ghana | 95.0 /100 | #105 | Exceptional 80.0% |
| Greeks | 94.8 /100 | #106 | Exceptional 80.0% |
| Immigrants | Jordan | 94.8 /100 | #107 | Exceptional 80.0% |
| Iranians | 94.3 /100 | #108 | Exceptional 80.0% |
| Immigrants | Argentina | 94.1 /100 | #109 | Exceptional 80.0% |
| Estonians | 94.0 /100 | #110 | Exceptional 80.0% |
| Immigrants | South America | 93.9 /100 | #111 | Exceptional 80.0% |
| Immigrants | Italy | 93.9 /100 | #112 | Exceptional 80.0% |
| Sri Lankans | 93.9 /100 | #113 | Exceptional 80.0% |
| Argentineans | 93.8 /100 | #114 | Exceptional 80.0% |
| Bermudans | 93.3 /100 | #115 | Exceptional 80.0% |
| Immigrants | Western Africa | 93.1 /100 | #116 | Exceptional 80.0% |
| Immigrants | Vietnam | 92.7 /100 | #117 | Exceptional 80.0% |
| Cape Verdeans | 92.7 /100 | #118 | Exceptional 80.0% |
| Immigrants | Taiwan | 92.5 /100 | #119 | Exceptional 80.0% |
Demographics Similar to Australians by In Labor Force | Age 20-64
In terms of in labor force | age 20-64, the demographic groups most similar to Australians are Cuban (79.5%, a difference of 0.0%), Immigrants from Netherlands (79.5%, a difference of 0.010%), Czechoslovakian (79.5%, a difference of 0.010%), Syrian (79.6%, a difference of 0.030%), and Armenian (79.5%, a difference of 0.040%).
| Demographics | Rating | Rank | In Labor Force | Age 20-64 |
| Laotians | 58.4 /100 | #169 | Average 79.6% |
| Slavs | 54.0 /100 | #170 | Average 79.6% |
| Immigrants | Switzerland | 53.3 /100 | #171 | Average 79.6% |
| Immigrants | Belgium | 53.1 /100 | #172 | Average 79.6% |
| Immigrants | Scotland | 52.4 /100 | #173 | Average 79.6% |
| Syrians | 50.0 /100 | #174 | Average 79.6% |
| Cubans | 46.1 /100 | #175 | Average 79.5% |
| Australians | 46.0 /100 | #176 | Average 79.5% |
| Immigrants | Netherlands | 45.2 /100 | #177 | Average 79.5% |
| Czechoslovakians | 44.3 /100 | #178 | Average 79.5% |
| Armenians | 41.4 /100 | #179 | Average 79.5% |
| Salvadorans | 41.0 /100 | #180 | Average 79.5% |
| Immigrants | Saudi Arabia | 37.7 /100 | #181 | Fair 79.5% |
| Malaysians | 37.1 /100 | #182 | Fair 79.5% |
| Immigrants | Hungary | 36.8 /100 | #183 | Fair 79.5% |