Pima vs Choctaw In Labor Force | Age 20-64
COMPARE
Pima
Choctaw
In Labor Force | Age 20-64
In Labor Force | Age 20-64 Comparison
Pima
Choctaw
69.0%
IN LABOR FORCE | AGE 20-64
0.0/ 100
METRIC RATING
347th/ 347
METRIC RANK
75.4%
IN LABOR FORCE | AGE 20-64
0.0/ 100
METRIC RATING
324th/ 347
METRIC RANK
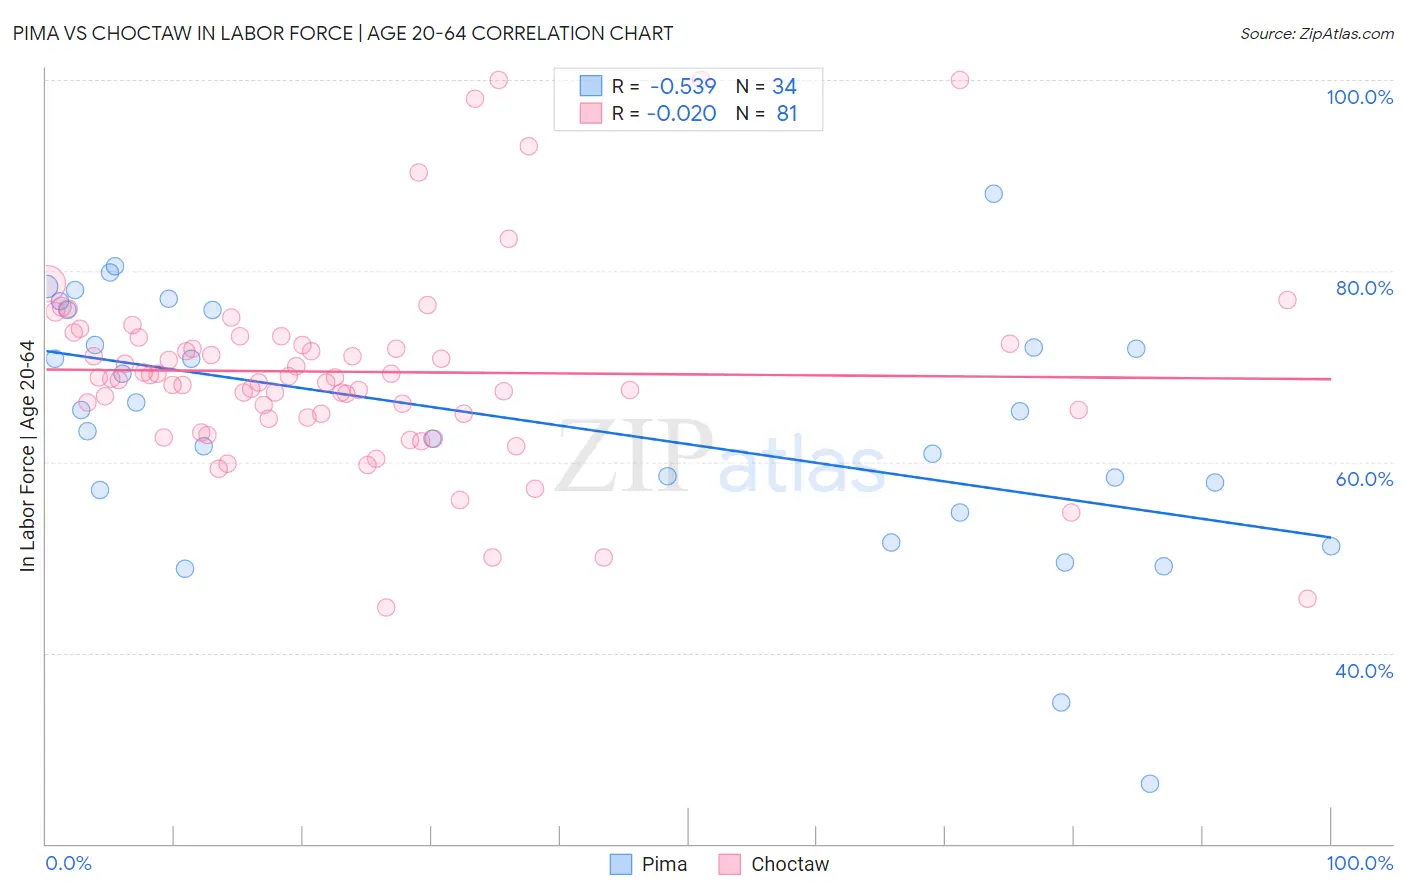
Pima vs Choctaw In Labor Force | Age 20-64 Correlation Chart
The statistical analysis conducted on geographies consisting of 61,542,645 people shows a substantial negative correlation between the proportion of Pima and labor force participation rate among population between the ages 20 and 64 in the United States with a correlation coefficient (R) of -0.539 and weighted average of 69.0%. Similarly, the statistical analysis conducted on geographies consisting of 269,719,618 people shows no correlation between the proportion of Choctaw and labor force participation rate among population between the ages 20 and 64 in the United States with a correlation coefficient (R) of -0.020 and weighted average of 75.4%, a difference of 9.2%.
In Labor Force | Age 20-64 Correlation Summary
| Measurement | Pima | Choctaw |
| Minimum | 26.3% | 44.7% |
| Maximum | 88.1% | 100.0% |
| Range | 61.8% | 55.3% |
| Mean | 64.1% | 69.4% |
| Median | 65.3% | 68.7% |
| Interquartile 25% (IQ1) | 57.1% | 64.8% |
| Interquartile 75% (IQ3) | 75.9% | 72.7% |
| Interquartile Range (IQR) | 18.8% | 7.9% |
| Standard Deviation (Sample) | 13.4% | 10.4% |
| Standard Deviation (Population) | 13.2% | 10.4% |
Similar Demographics by In Labor Force | Age 20-64
Demographics Similar to Pima by In Labor Force | Age 20-64
In terms of in labor force | age 20-64, the demographic groups most similar to Pima are Navajo (69.2%, a difference of 0.16%), Tohono O'odham (70.4%, a difference of 2.0%), Lumbee (70.6%, a difference of 2.3%), Hopi (71.7%, a difference of 3.9%), and Yuman (71.7%, a difference of 3.9%).
| Demographics | Rating | Rank | In Labor Force | Age 20-64 |
| Natives/Alaskans | 0.0 /100 | #333 | Tragic 73.9% |
| Apache | 0.0 /100 | #334 | Tragic 73.7% |
| Ute | 0.0 /100 | #335 | Tragic 73.7% |
| Crow | 0.0 /100 | #336 | Tragic 73.3% |
| Yup'ik | 0.0 /100 | #337 | Tragic 73.2% |
| Puerto Ricans | 0.0 /100 | #338 | Tragic 73.1% |
| Houma | 0.0 /100 | #339 | Tragic 72.7% |
| Pueblo | 0.0 /100 | #340 | Tragic 72.6% |
| Immigrants | Yemen | 0.0 /100 | #341 | Tragic 72.3% |
| Yuman | 0.0 /100 | #342 | Tragic 71.7% |
| Hopi | 0.0 /100 | #343 | Tragic 71.7% |
| Lumbee | 0.0 /100 | #344 | Tragic 70.6% |
| Tohono O'odham | 0.0 /100 | #345 | Tragic 70.4% |
| Navajo | 0.0 /100 | #346 | Tragic 69.2% |
| Pima | 0.0 /100 | #347 | Tragic 69.0% |
Demographics Similar to Choctaw by In Labor Force | Age 20-64
In terms of in labor force | age 20-64, the demographic groups most similar to Choctaw are Cajun (75.5%, a difference of 0.060%), Dutch West Indian (75.5%, a difference of 0.10%), Seminole (75.5%, a difference of 0.14%), Menominee (75.3%, a difference of 0.14%), and Creek (75.1%, a difference of 0.36%).
| Demographics | Rating | Rank | In Labor Force | Age 20-64 |
| Cherokee | 0.0 /100 | #317 | Tragic 76.2% |
| Chickasaw | 0.0 /100 | #318 | Tragic 76.2% |
| Inupiat | 0.0 /100 | #319 | Tragic 76.1% |
| Yakama | 0.0 /100 | #320 | Tragic 75.8% |
| Seminole | 0.0 /100 | #321 | Tragic 75.5% |
| Dutch West Indians | 0.0 /100 | #322 | Tragic 75.5% |
| Cajuns | 0.0 /100 | #323 | Tragic 75.5% |
| Choctaw | 0.0 /100 | #324 | Tragic 75.4% |
| Menominee | 0.0 /100 | #325 | Tragic 75.3% |
| Creek | 0.0 /100 | #326 | Tragic 75.1% |
| Sioux | 0.0 /100 | #327 | Tragic 75.0% |
| Kiowa | 0.0 /100 | #328 | Tragic 75.0% |
| Cheyenne | 0.0 /100 | #329 | Tragic 74.8% |
| Colville | 0.0 /100 | #330 | Tragic 74.8% |
| Paiute | 0.0 /100 | #331 | Tragic 74.7% |