Immigrants from Nigeria vs Australian In Labor Force | Age 20-64
COMPARE
Immigrants from Nigeria
Australian
In Labor Force | Age 20-64
In Labor Force | Age 20-64 Comparison
Immigrants from Nigeria
Australians
79.9%
IN LABOR FORCE | AGE 20-64
86.4/ 100
METRIC RATING
138th/ 347
METRIC RANK
79.5%
IN LABOR FORCE | AGE 20-64
46.0/ 100
METRIC RATING
176th/ 347
METRIC RANK
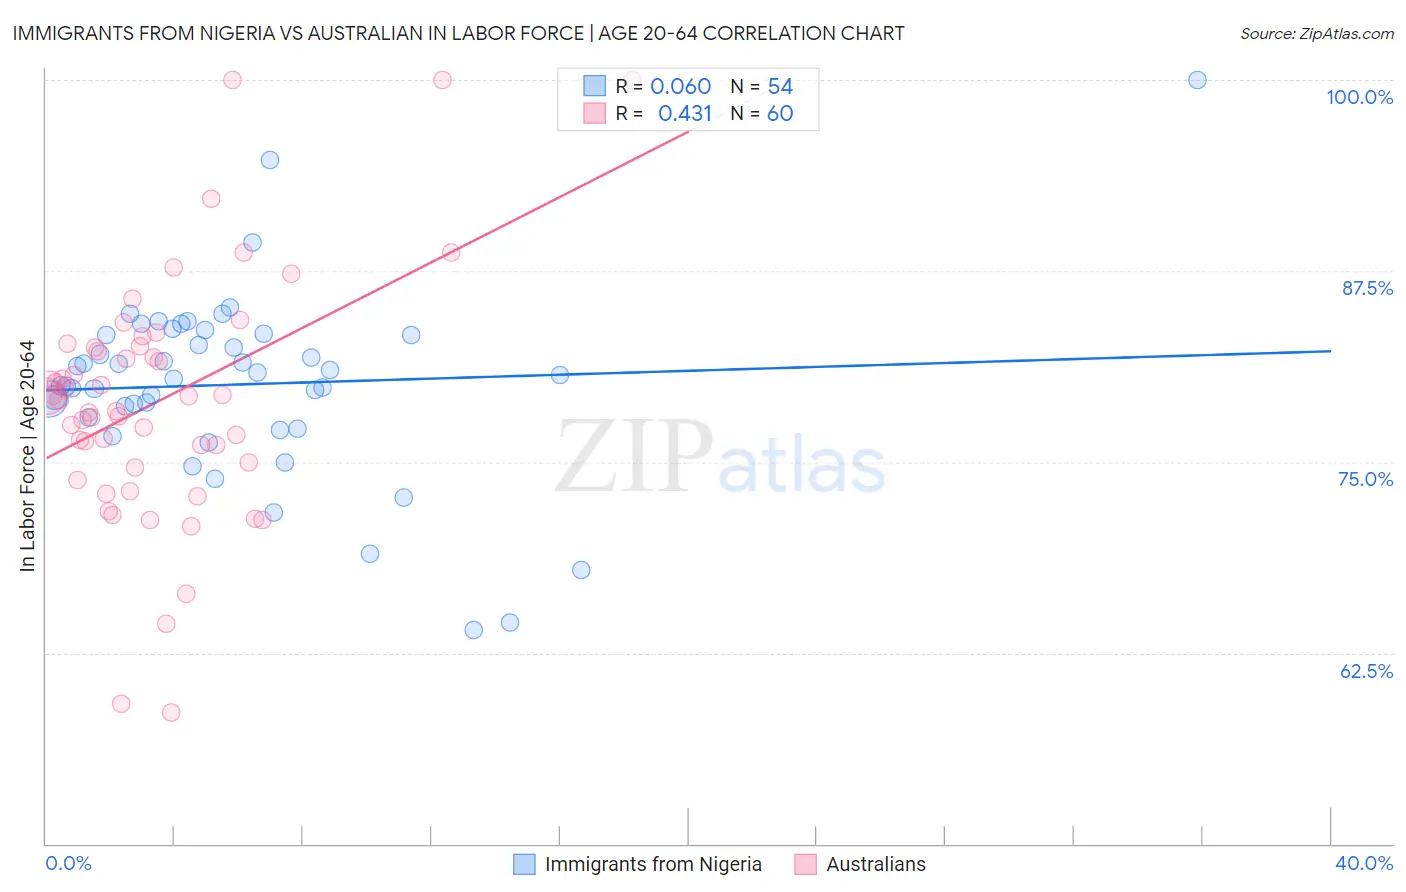
Immigrants from Nigeria vs Australian In Labor Force | Age 20-64 Correlation Chart
The statistical analysis conducted on geographies consisting of 283,492,708 people shows a slight positive correlation between the proportion of Immigrants from Nigeria and labor force participation rate among population between the ages 20 and 64 in the United States with a correlation coefficient (R) of 0.060 and weighted average of 79.9%. Similarly, the statistical analysis conducted on geographies consisting of 224,163,078 people shows a moderate positive correlation between the proportion of Australians and labor force participation rate among population between the ages 20 and 64 in the United States with a correlation coefficient (R) of 0.431 and weighted average of 79.5%, a difference of 0.40%.
In Labor Force | Age 20-64 Correlation Summary
| Measurement | Immigrants from Nigeria | Australian |
| Minimum | 64.0% | 58.6% |
| Maximum | 100.0% | 100.0% |
| Range | 36.0% | 41.4% |
| Mean | 80.1% | 79.0% |
| Median | 80.6% | 79.2% |
| Interquartile 25% (IQ1) | 77.9% | 74.8% |
| Interquartile 75% (IQ3) | 83.3% | 82.6% |
| Interquartile Range (IQR) | 5.4% | 7.8% |
| Standard Deviation (Sample) | 6.1% | 8.0% |
| Standard Deviation (Population) | 6.0% | 8.0% |
Similar Demographics by In Labor Force | Age 20-64
Demographics Similar to Immigrants from Nigeria by In Labor Force | Age 20-64
In terms of in labor force | age 20-64, the demographic groups most similar to Immigrants from Nigeria are Immigrants from Ukraine (79.9%, a difference of 0.0%), Ukrainian (79.9%, a difference of 0.010%), Immigrants from Singapore (79.9%, a difference of 0.010%), Indian (Asian) (79.9%, a difference of 0.020%), and South American Indian (79.9%, a difference of 0.020%).
| Demographics | Rating | Rank | In Labor Force | Age 20-64 |
| Immigrants | Iran | 88.3 /100 | #131 | Excellent 79.9% |
| Indians (Asian) | 87.7 /100 | #132 | Excellent 79.9% |
| South American Indians | 87.6 /100 | #133 | Excellent 79.9% |
| Belgians | 87.4 /100 | #134 | Excellent 79.9% |
| Ukrainians | 86.8 /100 | #135 | Excellent 79.9% |
| Immigrants | Singapore | 86.7 /100 | #136 | Excellent 79.9% |
| Immigrants | Ukraine | 86.5 /100 | #137 | Excellent 79.9% |
| Immigrants | Nigeria | 86.4 /100 | #138 | Excellent 79.9% |
| Immigrants | Spain | 83.9 /100 | #139 | Excellent 79.8% |
| Immigrants | South Eastern Asia | 80.4 /100 | #140 | Excellent 79.8% |
| Immigrants | Israel | 80.0 /100 | #141 | Good 79.8% |
| Slovaks | 79.9 /100 | #142 | Good 79.8% |
| Immigrants | Sweden | 79.7 /100 | #143 | Good 79.8% |
| Koreans | 79.6 /100 | #144 | Good 79.8% |
| Pakistanis | 79.3 /100 | #145 | Good 79.8% |
Demographics Similar to Australians by In Labor Force | Age 20-64
In terms of in labor force | age 20-64, the demographic groups most similar to Australians are Cuban (79.5%, a difference of 0.0%), Immigrants from Netherlands (79.5%, a difference of 0.010%), Czechoslovakian (79.5%, a difference of 0.010%), Syrian (79.6%, a difference of 0.030%), and Armenian (79.5%, a difference of 0.040%).
| Demographics | Rating | Rank | In Labor Force | Age 20-64 |
| Laotians | 58.4 /100 | #169 | Average 79.6% |
| Slavs | 54.0 /100 | #170 | Average 79.6% |
| Immigrants | Switzerland | 53.3 /100 | #171 | Average 79.6% |
| Immigrants | Belgium | 53.1 /100 | #172 | Average 79.6% |
| Immigrants | Scotland | 52.4 /100 | #173 | Average 79.6% |
| Syrians | 50.0 /100 | #174 | Average 79.6% |
| Cubans | 46.1 /100 | #175 | Average 79.5% |
| Australians | 46.0 /100 | #176 | Average 79.5% |
| Immigrants | Netherlands | 45.2 /100 | #177 | Average 79.5% |
| Czechoslovakians | 44.3 /100 | #178 | Average 79.5% |
| Armenians | 41.4 /100 | #179 | Average 79.5% |
| Salvadorans | 41.0 /100 | #180 | Average 79.5% |
| Immigrants | Saudi Arabia | 37.7 /100 | #181 | Fair 79.5% |
| Malaysians | 37.1 /100 | #182 | Fair 79.5% |
| Immigrants | Hungary | 36.8 /100 | #183 | Fair 79.5% |