Pima vs Bolivian In Labor Force | Age 20-64
COMPARE
Pima
Bolivian
In Labor Force | Age 20-64
In Labor Force | Age 20-64 Comparison
Pima
Bolivians
69.0%
IN LABOR FORCE | AGE 20-64
0.0/ 100
METRIC RATING
347th/ 347
METRIC RANK
81.7%
IN LABOR FORCE | AGE 20-64
100.0/ 100
METRIC RATING
5th/ 347
METRIC RANK
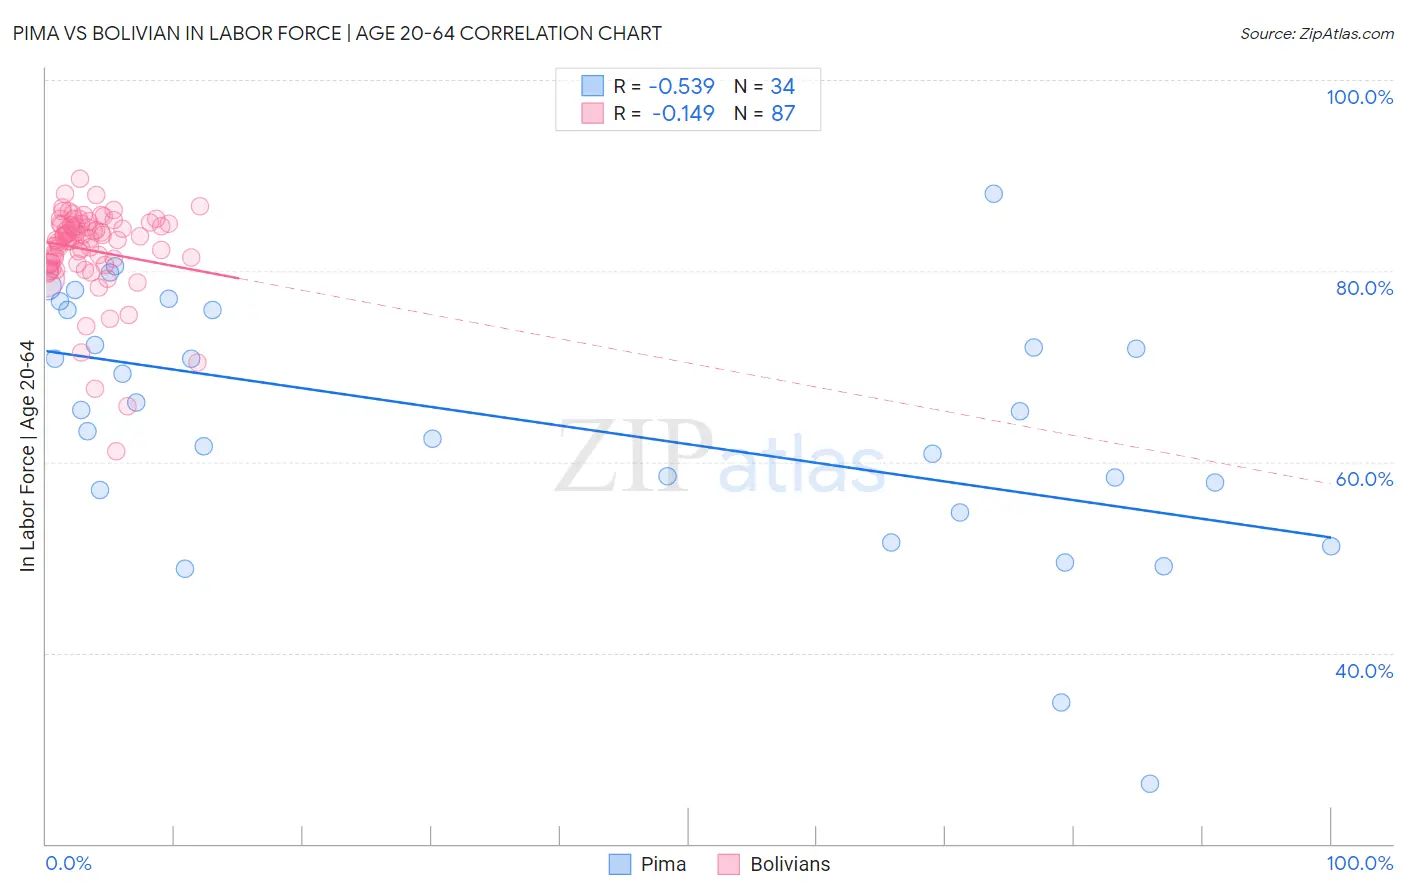
Pima vs Bolivian In Labor Force | Age 20-64 Correlation Chart
The statistical analysis conducted on geographies consisting of 61,542,645 people shows a substantial negative correlation between the proportion of Pima and labor force participation rate among population between the ages 20 and 64 in the United States with a correlation coefficient (R) of -0.539 and weighted average of 69.0%. Similarly, the statistical analysis conducted on geographies consisting of 184,684,128 people shows a poor negative correlation between the proportion of Bolivians and labor force participation rate among population between the ages 20 and 64 in the United States with a correlation coefficient (R) of -0.149 and weighted average of 81.7%, a difference of 18.3%.
In Labor Force | Age 20-64 Correlation Summary
| Measurement | Pima | Bolivian |
| Minimum | 26.3% | 61.1% |
| Maximum | 88.1% | 89.6% |
| Range | 61.8% | 28.5% |
| Mean | 64.1% | 82.2% |
| Median | 65.3% | 83.4% |
| Interquartile 25% (IQ1) | 57.1% | 80.8% |
| Interquartile 75% (IQ3) | 75.9% | 84.9% |
| Interquartile Range (IQR) | 18.8% | 4.1% |
| Standard Deviation (Sample) | 13.4% | 4.7% |
| Standard Deviation (Population) | 13.2% | 4.7% |
Similar Demographics by In Labor Force | Age 20-64
Demographics Similar to Pima by In Labor Force | Age 20-64
In terms of in labor force | age 20-64, the demographic groups most similar to Pima are Navajo (69.2%, a difference of 0.16%), Tohono O'odham (70.4%, a difference of 2.0%), Lumbee (70.6%, a difference of 2.3%), Hopi (71.7%, a difference of 3.9%), and Yuman (71.7%, a difference of 3.9%).
| Demographics | Rating | Rank | In Labor Force | Age 20-64 |
| Natives/Alaskans | 0.0 /100 | #333 | Tragic 73.9% |
| Apache | 0.0 /100 | #334 | Tragic 73.7% |
| Ute | 0.0 /100 | #335 | Tragic 73.7% |
| Crow | 0.0 /100 | #336 | Tragic 73.3% |
| Yup'ik | 0.0 /100 | #337 | Tragic 73.2% |
| Puerto Ricans | 0.0 /100 | #338 | Tragic 73.1% |
| Houma | 0.0 /100 | #339 | Tragic 72.7% |
| Pueblo | 0.0 /100 | #340 | Tragic 72.6% |
| Immigrants | Yemen | 0.0 /100 | #341 | Tragic 72.3% |
| Yuman | 0.0 /100 | #342 | Tragic 71.7% |
| Hopi | 0.0 /100 | #343 | Tragic 71.7% |
| Lumbee | 0.0 /100 | #344 | Tragic 70.6% |
| Tohono O'odham | 0.0 /100 | #345 | Tragic 70.4% |
| Navajo | 0.0 /100 | #346 | Tragic 69.2% |
| Pima | 0.0 /100 | #347 | Tragic 69.0% |
Demographics Similar to Bolivians by In Labor Force | Age 20-64
In terms of in labor force | age 20-64, the demographic groups most similar to Bolivians are Somali (81.6%, a difference of 0.11%), Immigrants from Cameroon (81.6%, a difference of 0.15%), Immigrants from Somalia (81.6%, a difference of 0.17%), Sierra Leonean (81.5%, a difference of 0.17%), and Luxembourger (81.9%, a difference of 0.20%).
| Demographics | Rating | Rank | In Labor Force | Age 20-64 |
| Immigrants | Ethiopia | 100.0 /100 | #1 | Exceptional 82.1% |
| Ethiopians | 100.0 /100 | #2 | Exceptional 82.0% |
| Immigrants | Bolivia | 100.0 /100 | #3 | Exceptional 81.9% |
| Luxembourgers | 100.0 /100 | #4 | Exceptional 81.9% |
| Bolivians | 100.0 /100 | #5 | Exceptional 81.7% |
| Somalis | 100.0 /100 | #6 | Exceptional 81.6% |
| Immigrants | Cameroon | 100.0 /100 | #7 | Exceptional 81.6% |
| Immigrants | Somalia | 100.0 /100 | #8 | Exceptional 81.6% |
| Sierra Leoneans | 100.0 /100 | #9 | Exceptional 81.5% |
| Immigrants | Sierra Leone | 100.0 /100 | #10 | Exceptional 81.5% |
| Immigrants | Eastern Africa | 100.0 /100 | #11 | Exceptional 81.3% |
| Immigrants | Eritrea | 100.0 /100 | #12 | Exceptional 81.3% |
| Immigrants | India | 100.0 /100 | #13 | Exceptional 81.3% |
| Cambodians | 100.0 /100 | #14 | Exceptional 81.1% |
| Bulgarians | 100.0 /100 | #15 | Exceptional 81.1% |