Somali vs Australian In Labor Force | Age 20-64
COMPARE
Somali
Australian
In Labor Force | Age 20-64
In Labor Force | Age 20-64 Comparison
Somalis
Australians
81.6%
IN LABOR FORCE | AGE 20-64
100.0/ 100
METRIC RATING
6th/ 347
METRIC RANK
79.5%
IN LABOR FORCE | AGE 20-64
46.0/ 100
METRIC RATING
176th/ 347
METRIC RANK
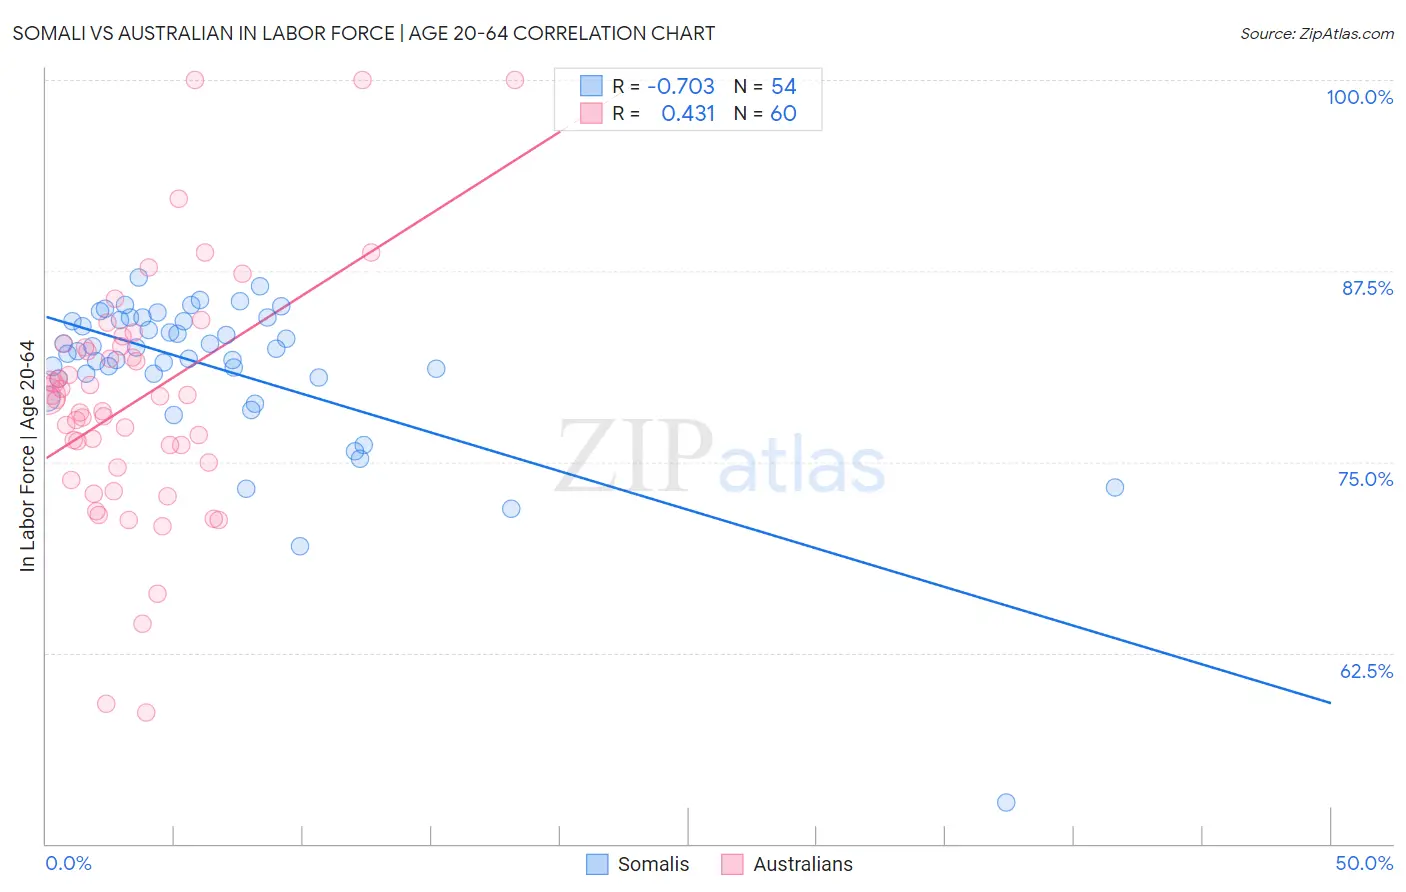
Somali vs Australian In Labor Force | Age 20-64 Correlation Chart
The statistical analysis conducted on geographies consisting of 99,331,399 people shows a strong negative correlation between the proportion of Somalis and labor force participation rate among population between the ages 20 and 64 in the United States with a correlation coefficient (R) of -0.703 and weighted average of 81.6%. Similarly, the statistical analysis conducted on geographies consisting of 224,163,078 people shows a moderate positive correlation between the proportion of Australians and labor force participation rate among population between the ages 20 and 64 in the United States with a correlation coefficient (R) of 0.431 and weighted average of 79.5%, a difference of 2.6%.
In Labor Force | Age 20-64 Correlation Summary
| Measurement | Somali | Australian |
| Minimum | 52.7% | 58.6% |
| Maximum | 87.1% | 100.0% |
| Range | 34.4% | 41.4% |
| Mean | 81.0% | 79.0% |
| Median | 82.3% | 79.2% |
| Interquartile 25% (IQ1) | 80.5% | 74.8% |
| Interquartile 75% (IQ3) | 84.3% | 82.6% |
| Interquartile Range (IQR) | 3.8% | 7.8% |
| Standard Deviation (Sample) | 5.5% | 8.0% |
| Standard Deviation (Population) | 5.4% | 8.0% |
Similar Demographics by In Labor Force | Age 20-64
Demographics Similar to Somalis by In Labor Force | Age 20-64
In terms of in labor force | age 20-64, the demographic groups most similar to Somalis are Immigrants from Cameroon (81.6%, a difference of 0.040%), Immigrants from Somalia (81.6%, a difference of 0.060%), Sierra Leonean (81.5%, a difference of 0.060%), Bolivian (81.7%, a difference of 0.11%), and Immigrants from Sierra Leone (81.5%, a difference of 0.18%).
| Demographics | Rating | Rank | In Labor Force | Age 20-64 |
| Immigrants | Ethiopia | 100.0 /100 | #1 | Exceptional 82.1% |
| Ethiopians | 100.0 /100 | #2 | Exceptional 82.0% |
| Immigrants | Bolivia | 100.0 /100 | #3 | Exceptional 81.9% |
| Luxembourgers | 100.0 /100 | #4 | Exceptional 81.9% |
| Bolivians | 100.0 /100 | #5 | Exceptional 81.7% |
| Somalis | 100.0 /100 | #6 | Exceptional 81.6% |
| Immigrants | Cameroon | 100.0 /100 | #7 | Exceptional 81.6% |
| Immigrants | Somalia | 100.0 /100 | #8 | Exceptional 81.6% |
| Sierra Leoneans | 100.0 /100 | #9 | Exceptional 81.5% |
| Immigrants | Sierra Leone | 100.0 /100 | #10 | Exceptional 81.5% |
| Immigrants | Eastern Africa | 100.0 /100 | #11 | Exceptional 81.3% |
| Immigrants | Eritrea | 100.0 /100 | #12 | Exceptional 81.3% |
| Immigrants | India | 100.0 /100 | #13 | Exceptional 81.3% |
| Cambodians | 100.0 /100 | #14 | Exceptional 81.1% |
| Bulgarians | 100.0 /100 | #15 | Exceptional 81.1% |
Demographics Similar to Australians by In Labor Force | Age 20-64
In terms of in labor force | age 20-64, the demographic groups most similar to Australians are Cuban (79.5%, a difference of 0.0%), Immigrants from Netherlands (79.5%, a difference of 0.010%), Czechoslovakian (79.5%, a difference of 0.010%), Syrian (79.6%, a difference of 0.030%), and Armenian (79.5%, a difference of 0.040%).
| Demographics | Rating | Rank | In Labor Force | Age 20-64 |
| Laotians | 58.4 /100 | #169 | Average 79.6% |
| Slavs | 54.0 /100 | #170 | Average 79.6% |
| Immigrants | Switzerland | 53.3 /100 | #171 | Average 79.6% |
| Immigrants | Belgium | 53.1 /100 | #172 | Average 79.6% |
| Immigrants | Scotland | 52.4 /100 | #173 | Average 79.6% |
| Syrians | 50.0 /100 | #174 | Average 79.6% |
| Cubans | 46.1 /100 | #175 | Average 79.5% |
| Australians | 46.0 /100 | #176 | Average 79.5% |
| Immigrants | Netherlands | 45.2 /100 | #177 | Average 79.5% |
| Czechoslovakians | 44.3 /100 | #178 | Average 79.5% |
| Armenians | 41.4 /100 | #179 | Average 79.5% |
| Salvadorans | 41.0 /100 | #180 | Average 79.5% |
| Immigrants | Saudi Arabia | 37.7 /100 | #181 | Fair 79.5% |
| Malaysians | 37.1 /100 | #182 | Fair 79.5% |
| Immigrants | Hungary | 36.8 /100 | #183 | Fair 79.5% |