Ottawa vs New Zealander In Labor Force | Age 35-44
COMPARE
Ottawa
New Zealander
In Labor Force | Age 35-44
In Labor Force | Age 35-44 Comparison
Ottawa
New Zealanders
82.6%
IN LABOR FORCE | AGE 35-44
0.0/ 100
METRIC RATING
298th/ 347
METRIC RANK
84.1%
IN LABOR FORCE | AGE 35-44
16.2/ 100
METRIC RATING
210th/ 347
METRIC RANK
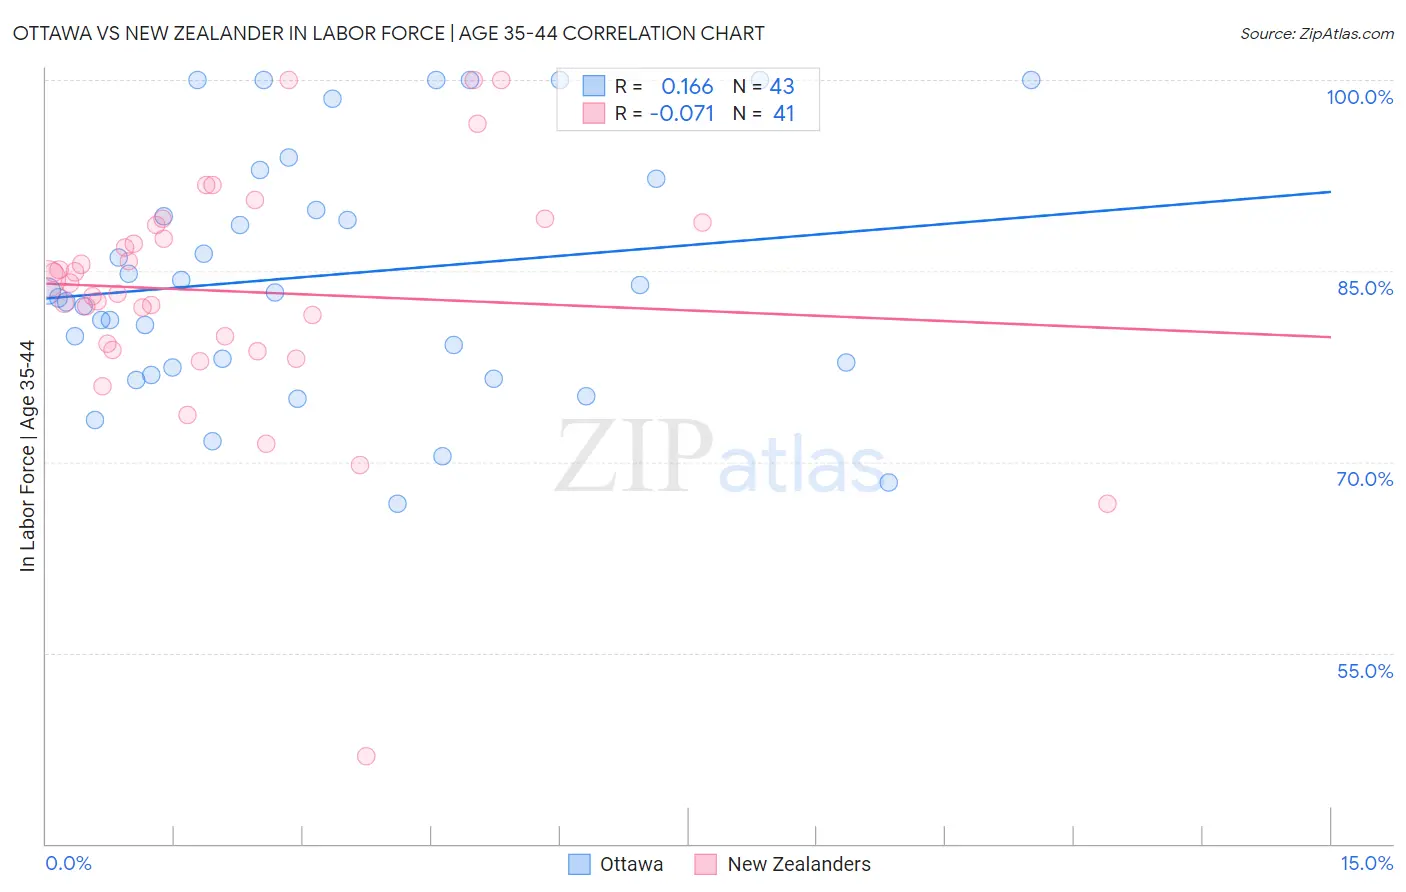
Ottawa vs New Zealander In Labor Force | Age 35-44 Correlation Chart
The statistical analysis conducted on geographies consisting of 49,950,273 people shows a poor positive correlation between the proportion of Ottawa and labor force participation rate among population between the ages 35 and 44 in the United States with a correlation coefficient (R) of 0.166 and weighted average of 82.6%. Similarly, the statistical analysis conducted on geographies consisting of 106,898,778 people shows a slight negative correlation between the proportion of New Zealanders and labor force participation rate among population between the ages 35 and 44 in the United States with a correlation coefficient (R) of -0.071 and weighted average of 84.1%, a difference of 1.9%.
In Labor Force | Age 35-44 Correlation Summary
| Measurement | Ottawa | New Zealander |
| Minimum | 66.7% | 46.9% |
| Maximum | 100.0% | 100.0% |
| Range | 33.3% | 53.1% |
| Mean | 84.6% | 83.4% |
| Median | 83.3% | 84.0% |
| Interquartile 25% (IQ1) | 77.4% | 79.0% |
| Interquartile 75% (IQ3) | 92.2% | 88.7% |
| Interquartile Range (IQR) | 14.8% | 9.7% |
| Standard Deviation (Sample) | 9.6% | 9.5% |
| Standard Deviation (Population) | 9.5% | 9.4% |
Similar Demographics by In Labor Force | Age 35-44
Demographics Similar to Ottawa by In Labor Force | Age 35-44
In terms of in labor force | age 35-44, the demographic groups most similar to Ottawa are Tlingit-Haida (82.5%, a difference of 0.010%), Mexican American Indian (82.6%, a difference of 0.020%), Hmong (82.6%, a difference of 0.020%), Central American Indian (82.5%, a difference of 0.080%), and Spanish American Indian (82.5%, a difference of 0.10%).
| Demographics | Rating | Rank | In Labor Force | Age 35-44 |
| Pennsylvania Germans | 0.0 /100 | #291 | Tragic 82.9% |
| Immigrants | Latin America | 0.0 /100 | #292 | Tragic 82.8% |
| Spanish Americans | 0.0 /100 | #293 | Tragic 82.8% |
| Potawatomi | 0.0 /100 | #294 | Tragic 82.7% |
| Immigrants | Lebanon | 0.0 /100 | #295 | Tragic 82.7% |
| Mexican American Indians | 0.0 /100 | #296 | Tragic 82.6% |
| Hmong | 0.0 /100 | #297 | Tragic 82.6% |
| Ottawa | 0.0 /100 | #298 | Tragic 82.6% |
| Tlingit-Haida | 0.0 /100 | #299 | Tragic 82.5% |
| Central American Indians | 0.0 /100 | #300 | Tragic 82.5% |
| Spanish American Indians | 0.0 /100 | #301 | Tragic 82.5% |
| Americans | 0.0 /100 | #302 | Tragic 82.4% |
| Nepalese | 0.0 /100 | #303 | Tragic 82.4% |
| Marshallese | 0.0 /100 | #304 | Tragic 82.4% |
| Shoshone | 0.0 /100 | #305 | Tragic 82.2% |
Demographics Similar to New Zealanders by In Labor Force | Age 35-44
In terms of in labor force | age 35-44, the demographic groups most similar to New Zealanders are Swiss (84.2%, a difference of 0.010%), Immigrants from Ecuador (84.1%, a difference of 0.010%), Immigrants from North America (84.2%, a difference of 0.020%), Laotian (84.2%, a difference of 0.030%), and Israeli (84.1%, a difference of 0.030%).
| Demographics | Rating | Rank | In Labor Force | Age 35-44 |
| Immigrants | South Eastern Asia | 22.4 /100 | #203 | Fair 84.2% |
| Canadians | 19.9 /100 | #204 | Poor 84.2% |
| Immigrants | Canada | 19.6 /100 | #205 | Poor 84.2% |
| Immigrants | Costa Rica | 19.5 /100 | #206 | Poor 84.2% |
| Laotians | 19.0 /100 | #207 | Poor 84.2% |
| Immigrants | North America | 18.1 /100 | #208 | Poor 84.2% |
| Swiss | 17.4 /100 | #209 | Poor 84.2% |
| New Zealanders | 16.2 /100 | #210 | Poor 84.1% |
| Immigrants | Ecuador | 15.2 /100 | #211 | Poor 84.1% |
| Israelis | 14.0 /100 | #212 | Poor 84.1% |
| Bangladeshis | 13.7 /100 | #213 | Poor 84.1% |
| Immigrants | Barbados | 13.2 /100 | #214 | Poor 84.1% |
| Europeans | 12.2 /100 | #215 | Poor 84.1% |
| Nicaraguans | 12.1 /100 | #216 | Poor 84.1% |
| Immigrants | Norway | 11.7 /100 | #217 | Poor 84.1% |