Ottawa vs Belizean In Labor Force | Age 35-44
COMPARE
Ottawa
Belizean
In Labor Force | Age 35-44
In Labor Force | Age 35-44 Comparison
Ottawa
Belizeans
82.6%
IN LABOR FORCE | AGE 35-44
0.0/ 100
METRIC RATING
298th/ 347
METRIC RANK
83.1%
IN LABOR FORCE | AGE 35-44
0.0/ 100
METRIC RATING
278th/ 347
METRIC RANK
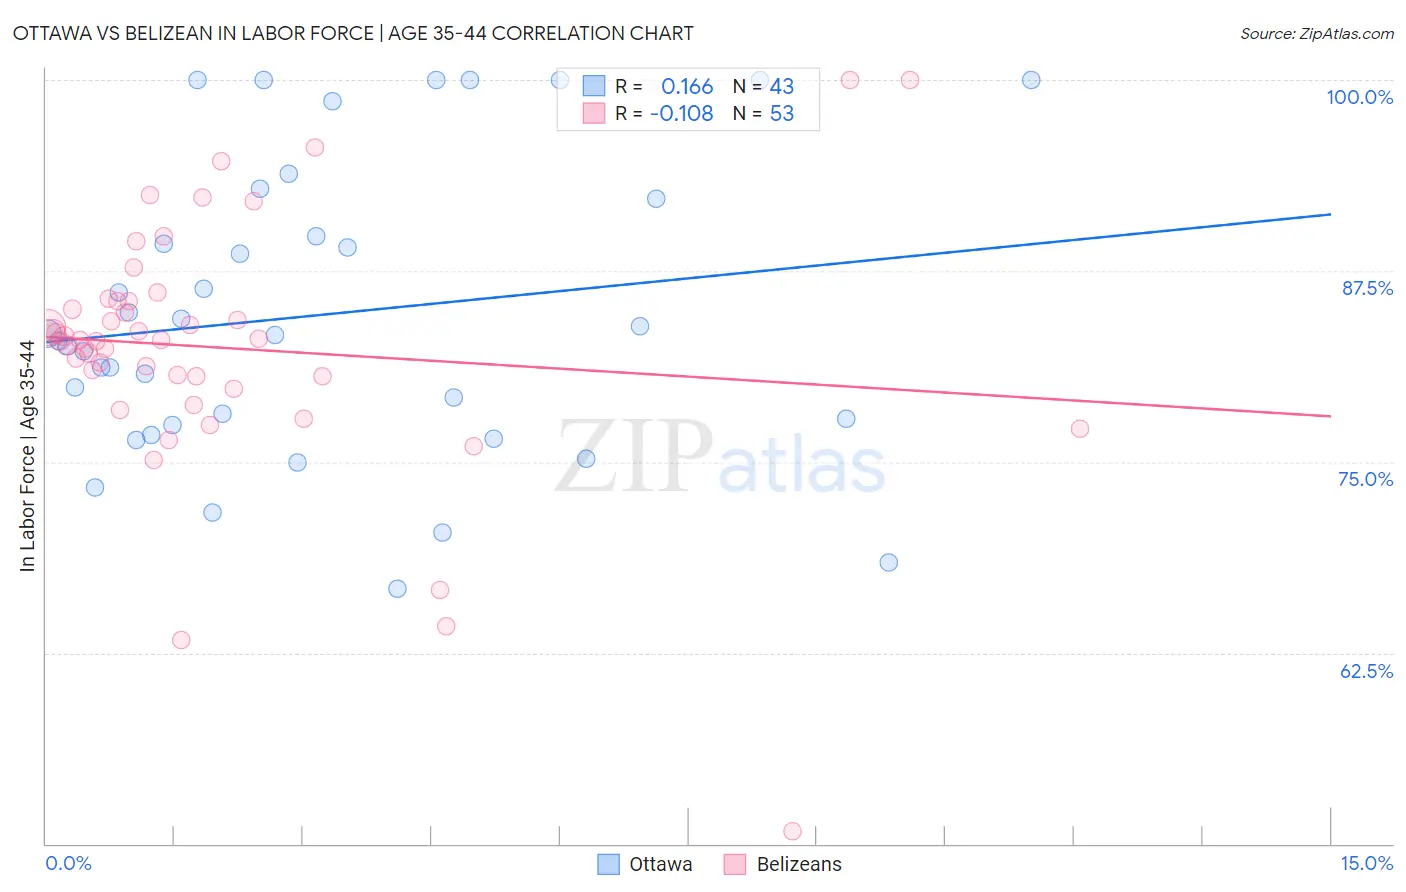
Ottawa vs Belizean In Labor Force | Age 35-44 Correlation Chart
The statistical analysis conducted on geographies consisting of 49,950,273 people shows a poor positive correlation between the proportion of Ottawa and labor force participation rate among population between the ages 35 and 44 in the United States with a correlation coefficient (R) of 0.166 and weighted average of 82.6%. Similarly, the statistical analysis conducted on geographies consisting of 144,190,758 people shows a poor negative correlation between the proportion of Belizeans and labor force participation rate among population between the ages 35 and 44 in the United States with a correlation coefficient (R) of -0.108 and weighted average of 83.1%, a difference of 0.70%.
In Labor Force | Age 35-44 Correlation Summary
| Measurement | Ottawa | Belizean |
| Minimum | 66.7% | 50.8% |
| Maximum | 100.0% | 100.0% |
| Range | 33.3% | 49.2% |
| Mean | 84.6% | 82.5% |
| Median | 83.3% | 83.0% |
| Interquartile 25% (IQ1) | 77.4% | 80.2% |
| Interquartile 75% (IQ3) | 92.2% | 85.5% |
| Interquartile Range (IQR) | 14.8% | 5.4% |
| Standard Deviation (Sample) | 9.6% | 8.4% |
| Standard Deviation (Population) | 9.5% | 8.3% |
Demographics Similar to Ottawa and Belizeans by In Labor Force | Age 35-44
In terms of in labor force | age 35-44, the demographic groups most similar to Ottawa are Mexican American Indian (82.6%, a difference of 0.020%), Hmong (82.6%, a difference of 0.020%), Immigrants from Lebanon (82.7%, a difference of 0.12%), Potawatomi (82.7%, a difference of 0.17%), and Spanish American (82.8%, a difference of 0.25%). Similarly, the demographic groups most similar to Belizeans are Immigrants from Micronesia (83.1%, a difference of 0.010%), Dominican (83.1%, a difference of 0.050%), Guatemalan (83.0%, a difference of 0.18%), Osage (82.9%, a difference of 0.22%), and Immigrants from Guatemala (82.9%, a difference of 0.22%).
| Demographics | Rating | Rank | In Labor Force | Age 35-44 |
| Belizeans | 0.0 /100 | #278 | Tragic 83.1% |
| Immigrants | Micronesia | 0.0 /100 | #279 | Tragic 83.1% |
| Dominicans | 0.0 /100 | #280 | Tragic 83.1% |
| Guatemalans | 0.0 /100 | #281 | Tragic 83.0% |
| Osage | 0.0 /100 | #282 | Tragic 82.9% |
| Immigrants | Guatemala | 0.0 /100 | #283 | Tragic 82.9% |
| Immigrants | Dominican Republic | 0.0 /100 | #284 | Tragic 82.9% |
| Fijians | 0.0 /100 | #285 | Tragic 82.9% |
| Immigrants | Bangladesh | 0.0 /100 | #286 | Tragic 82.9% |
| Immigrants | Belize | 0.0 /100 | #287 | Tragic 82.9% |
| Puget Sound Salish | 0.0 /100 | #288 | Tragic 82.9% |
| Chippewa | 0.0 /100 | #289 | Tragic 82.9% |
| Africans | 0.0 /100 | #290 | Tragic 82.9% |
| Pennsylvania Germans | 0.0 /100 | #291 | Tragic 82.9% |
| Immigrants | Latin America | 0.0 /100 | #292 | Tragic 82.8% |
| Spanish Americans | 0.0 /100 | #293 | Tragic 82.8% |
| Potawatomi | 0.0 /100 | #294 | Tragic 82.7% |
| Immigrants | Lebanon | 0.0 /100 | #295 | Tragic 82.7% |
| Mexican American Indians | 0.0 /100 | #296 | Tragic 82.6% |
| Hmong | 0.0 /100 | #297 | Tragic 82.6% |
| Ottawa | 0.0 /100 | #298 | Tragic 82.6% |