Immigrants from Belize vs New Zealander In Labor Force | Age 35-44
COMPARE
Immigrants from Belize
New Zealander
In Labor Force | Age 35-44
In Labor Force | Age 35-44 Comparison
Immigrants from Belize
New Zealanders
82.9%
IN LABOR FORCE | AGE 35-44
0.0/ 100
METRIC RATING
287th/ 347
METRIC RANK
84.1%
IN LABOR FORCE | AGE 35-44
16.2/ 100
METRIC RATING
210th/ 347
METRIC RANK
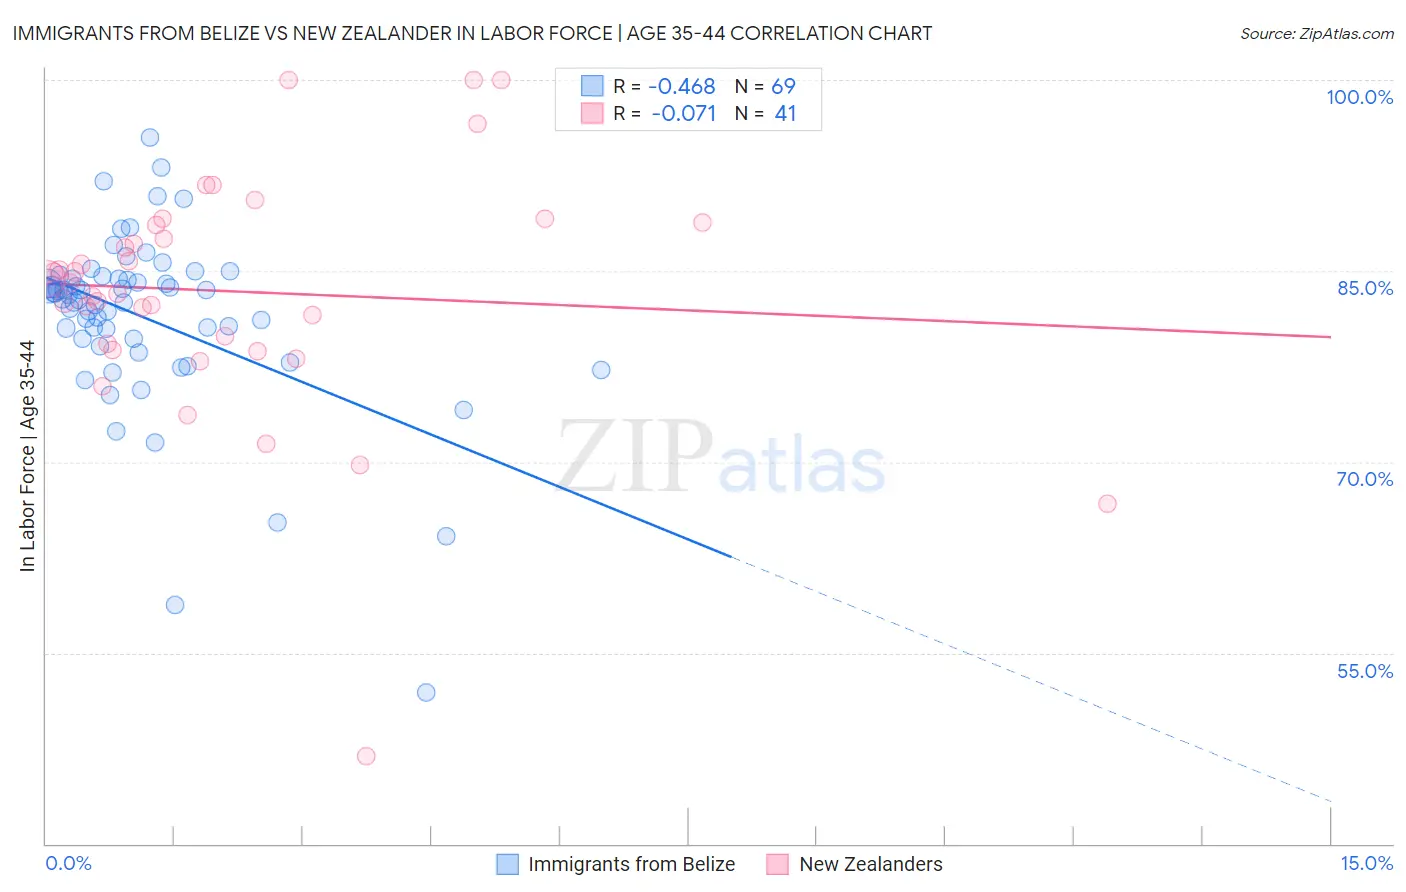
Immigrants from Belize vs New Zealander In Labor Force | Age 35-44 Correlation Chart
The statistical analysis conducted on geographies consisting of 130,306,944 people shows a moderate negative correlation between the proportion of Immigrants from Belize and labor force participation rate among population between the ages 35 and 44 in the United States with a correlation coefficient (R) of -0.468 and weighted average of 82.9%. Similarly, the statistical analysis conducted on geographies consisting of 106,898,778 people shows a slight negative correlation between the proportion of New Zealanders and labor force participation rate among population between the ages 35 and 44 in the United States with a correlation coefficient (R) of -0.071 and weighted average of 84.1%, a difference of 1.5%.
In Labor Force | Age 35-44 Correlation Summary
| Measurement | Immigrants from Belize | New Zealander |
| Minimum | 51.9% | 46.9% |
| Maximum | 95.5% | 100.0% |
| Range | 43.6% | 53.1% |
| Mean | 81.3% | 83.4% |
| Median | 82.8% | 84.0% |
| Interquartile 25% (IQ1) | 79.3% | 79.0% |
| Interquartile 75% (IQ3) | 84.4% | 88.7% |
| Interquartile Range (IQR) | 5.1% | 9.7% |
| Standard Deviation (Sample) | 7.0% | 9.5% |
| Standard Deviation (Population) | 7.0% | 9.4% |
Similar Demographics by In Labor Force | Age 35-44
Demographics Similar to Immigrants from Belize by In Labor Force | Age 35-44
In terms of in labor force | age 35-44, the demographic groups most similar to Immigrants from Belize are Fijian (82.9%, a difference of 0.0%), Immigrants from Bangladesh (82.9%, a difference of 0.0%), Immigrants from Dominican Republic (82.9%, a difference of 0.020%), Puget Sound Salish (82.9%, a difference of 0.020%), and Osage (82.9%, a difference of 0.030%).
| Demographics | Rating | Rank | In Labor Force | Age 35-44 |
| Dominicans | 0.0 /100 | #280 | Tragic 83.1% |
| Guatemalans | 0.0 /100 | #281 | Tragic 83.0% |
| Osage | 0.0 /100 | #282 | Tragic 82.9% |
| Immigrants | Guatemala | 0.0 /100 | #283 | Tragic 82.9% |
| Immigrants | Dominican Republic | 0.0 /100 | #284 | Tragic 82.9% |
| Fijians | 0.0 /100 | #285 | Tragic 82.9% |
| Immigrants | Bangladesh | 0.0 /100 | #286 | Tragic 82.9% |
| Immigrants | Belize | 0.0 /100 | #287 | Tragic 82.9% |
| Puget Sound Salish | 0.0 /100 | #288 | Tragic 82.9% |
| Chippewa | 0.0 /100 | #289 | Tragic 82.9% |
| Africans | 0.0 /100 | #290 | Tragic 82.9% |
| Pennsylvania Germans | 0.0 /100 | #291 | Tragic 82.9% |
| Immigrants | Latin America | 0.0 /100 | #292 | Tragic 82.8% |
| Spanish Americans | 0.0 /100 | #293 | Tragic 82.8% |
| Potawatomi | 0.0 /100 | #294 | Tragic 82.7% |
Demographics Similar to New Zealanders by In Labor Force | Age 35-44
In terms of in labor force | age 35-44, the demographic groups most similar to New Zealanders are Swiss (84.2%, a difference of 0.010%), Immigrants from Ecuador (84.1%, a difference of 0.010%), Immigrants from North America (84.2%, a difference of 0.020%), Laotian (84.2%, a difference of 0.030%), and Israeli (84.1%, a difference of 0.030%).
| Demographics | Rating | Rank | In Labor Force | Age 35-44 |
| Immigrants | South Eastern Asia | 22.4 /100 | #203 | Fair 84.2% |
| Canadians | 19.9 /100 | #204 | Poor 84.2% |
| Immigrants | Canada | 19.6 /100 | #205 | Poor 84.2% |
| Immigrants | Costa Rica | 19.5 /100 | #206 | Poor 84.2% |
| Laotians | 19.0 /100 | #207 | Poor 84.2% |
| Immigrants | North America | 18.1 /100 | #208 | Poor 84.2% |
| Swiss | 17.4 /100 | #209 | Poor 84.2% |
| New Zealanders | 16.2 /100 | #210 | Poor 84.1% |
| Immigrants | Ecuador | 15.2 /100 | #211 | Poor 84.1% |
| Israelis | 14.0 /100 | #212 | Poor 84.1% |
| Bangladeshis | 13.7 /100 | #213 | Poor 84.1% |
| Immigrants | Barbados | 13.2 /100 | #214 | Poor 84.1% |
| Europeans | 12.2 /100 | #215 | Poor 84.1% |
| Nicaraguans | 12.1 /100 | #216 | Poor 84.1% |
| Immigrants | Norway | 11.7 /100 | #217 | Poor 84.1% |