Ottawa vs Immigrants from Spain In Labor Force | Age 35-44
COMPARE
Ottawa
Immigrants from Spain
In Labor Force | Age 35-44
In Labor Force | Age 35-44 Comparison
Ottawa
Immigrants from Spain
82.6%
IN LABOR FORCE | AGE 35-44
0.0/ 100
METRIC RATING
298th/ 347
METRIC RANK
84.7%
IN LABOR FORCE | AGE 35-44
90.6/ 100
METRIC RATING
127th/ 347
METRIC RANK
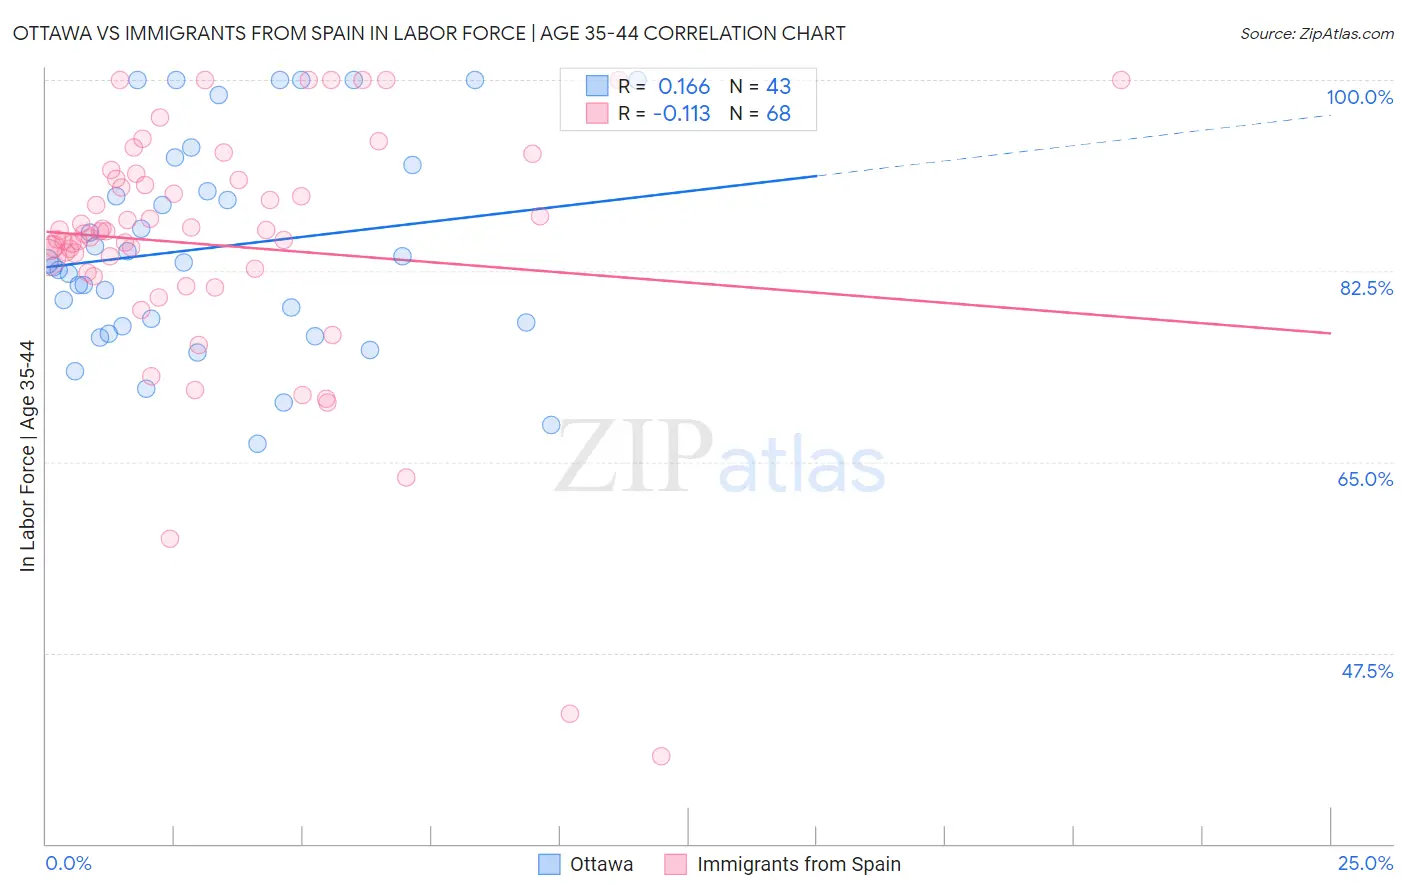
Ottawa vs Immigrants from Spain In Labor Force | Age 35-44 Correlation Chart
The statistical analysis conducted on geographies consisting of 49,950,273 people shows a poor positive correlation between the proportion of Ottawa and labor force participation rate among population between the ages 35 and 44 in the United States with a correlation coefficient (R) of 0.166 and weighted average of 82.6%. Similarly, the statistical analysis conducted on geographies consisting of 239,621,275 people shows a poor negative correlation between the proportion of Immigrants from Spain and labor force participation rate among population between the ages 35 and 44 in the United States with a correlation coefficient (R) of -0.113 and weighted average of 84.7%, a difference of 2.6%.
In Labor Force | Age 35-44 Correlation Summary
| Measurement | Ottawa | Immigrants from Spain |
| Minimum | 66.7% | 38.0% |
| Maximum | 100.0% | 100.0% |
| Range | 33.3% | 62.0% |
| Mean | 84.6% | 84.9% |
| Median | 83.3% | 86.0% |
| Interquartile 25% (IQ1) | 77.4% | 82.5% |
| Interquartile 75% (IQ3) | 92.2% | 90.9% |
| Interquartile Range (IQR) | 14.8% | 8.4% |
| Standard Deviation (Sample) | 9.6% | 11.7% |
| Standard Deviation (Population) | 9.5% | 11.6% |
Similar Demographics by In Labor Force | Age 35-44
Demographics Similar to Ottawa by In Labor Force | Age 35-44
In terms of in labor force | age 35-44, the demographic groups most similar to Ottawa are Tlingit-Haida (82.5%, a difference of 0.010%), Mexican American Indian (82.6%, a difference of 0.020%), Hmong (82.6%, a difference of 0.020%), Central American Indian (82.5%, a difference of 0.080%), and Spanish American Indian (82.5%, a difference of 0.10%).
| Demographics | Rating | Rank | In Labor Force | Age 35-44 |
| Pennsylvania Germans | 0.0 /100 | #291 | Tragic 82.9% |
| Immigrants | Latin America | 0.0 /100 | #292 | Tragic 82.8% |
| Spanish Americans | 0.0 /100 | #293 | Tragic 82.8% |
| Potawatomi | 0.0 /100 | #294 | Tragic 82.7% |
| Immigrants | Lebanon | 0.0 /100 | #295 | Tragic 82.7% |
| Mexican American Indians | 0.0 /100 | #296 | Tragic 82.6% |
| Hmong | 0.0 /100 | #297 | Tragic 82.6% |
| Ottawa | 0.0 /100 | #298 | Tragic 82.6% |
| Tlingit-Haida | 0.0 /100 | #299 | Tragic 82.5% |
| Central American Indians | 0.0 /100 | #300 | Tragic 82.5% |
| Spanish American Indians | 0.0 /100 | #301 | Tragic 82.5% |
| Americans | 0.0 /100 | #302 | Tragic 82.4% |
| Nepalese | 0.0 /100 | #303 | Tragic 82.4% |
| Marshallese | 0.0 /100 | #304 | Tragic 82.4% |
| Shoshone | 0.0 /100 | #305 | Tragic 82.2% |
Demographics Similar to Immigrants from Spain by In Labor Force | Age 35-44
In terms of in labor force | age 35-44, the demographic groups most similar to Immigrants from Spain are Slavic (84.7%, a difference of 0.0%), Maltese (84.7%, a difference of 0.0%), Asian (84.7%, a difference of 0.0%), Immigrants from Ghana (84.7%, a difference of 0.0%), and Finnish (84.7%, a difference of 0.010%).
| Demographics | Rating | Rank | In Labor Force | Age 35-44 |
| Immigrants | Northern Europe | 91.5 /100 | #120 | Exceptional 84.7% |
| Finns | 91.2 /100 | #121 | Exceptional 84.7% |
| Germans | 91.0 /100 | #122 | Exceptional 84.7% |
| Immigrants | South America | 90.9 /100 | #123 | Exceptional 84.7% |
| Slavs | 90.8 /100 | #124 | Exceptional 84.7% |
| Maltese | 90.8 /100 | #125 | Exceptional 84.7% |
| Asians | 90.6 /100 | #126 | Exceptional 84.7% |
| Immigrants | Spain | 90.6 /100 | #127 | Exceptional 84.7% |
| Immigrants | Ghana | 90.4 /100 | #128 | Exceptional 84.7% |
| Palestinians | 89.7 /100 | #129 | Excellent 84.7% |
| Bhutanese | 89.7 /100 | #130 | Excellent 84.7% |
| Immigrants | Scotland | 89.6 /100 | #131 | Excellent 84.7% |
| Austrians | 89.4 /100 | #132 | Excellent 84.7% |
| Argentineans | 88.4 /100 | #133 | Excellent 84.6% |
| Immigrants | Korea | 88.2 /100 | #134 | Excellent 84.6% |