Ottawa vs Immigrants from Iraq In Labor Force | Age 35-44
COMPARE
Ottawa
Immigrants from Iraq
In Labor Force | Age 35-44
In Labor Force | Age 35-44 Comparison
Ottawa
Immigrants from Iraq
82.6%
IN LABOR FORCE | AGE 35-44
0.0/ 100
METRIC RATING
298th/ 347
METRIC RANK
83.9%
IN LABOR FORCE | AGE 35-44
3.7/ 100
METRIC RATING
230th/ 347
METRIC RANK
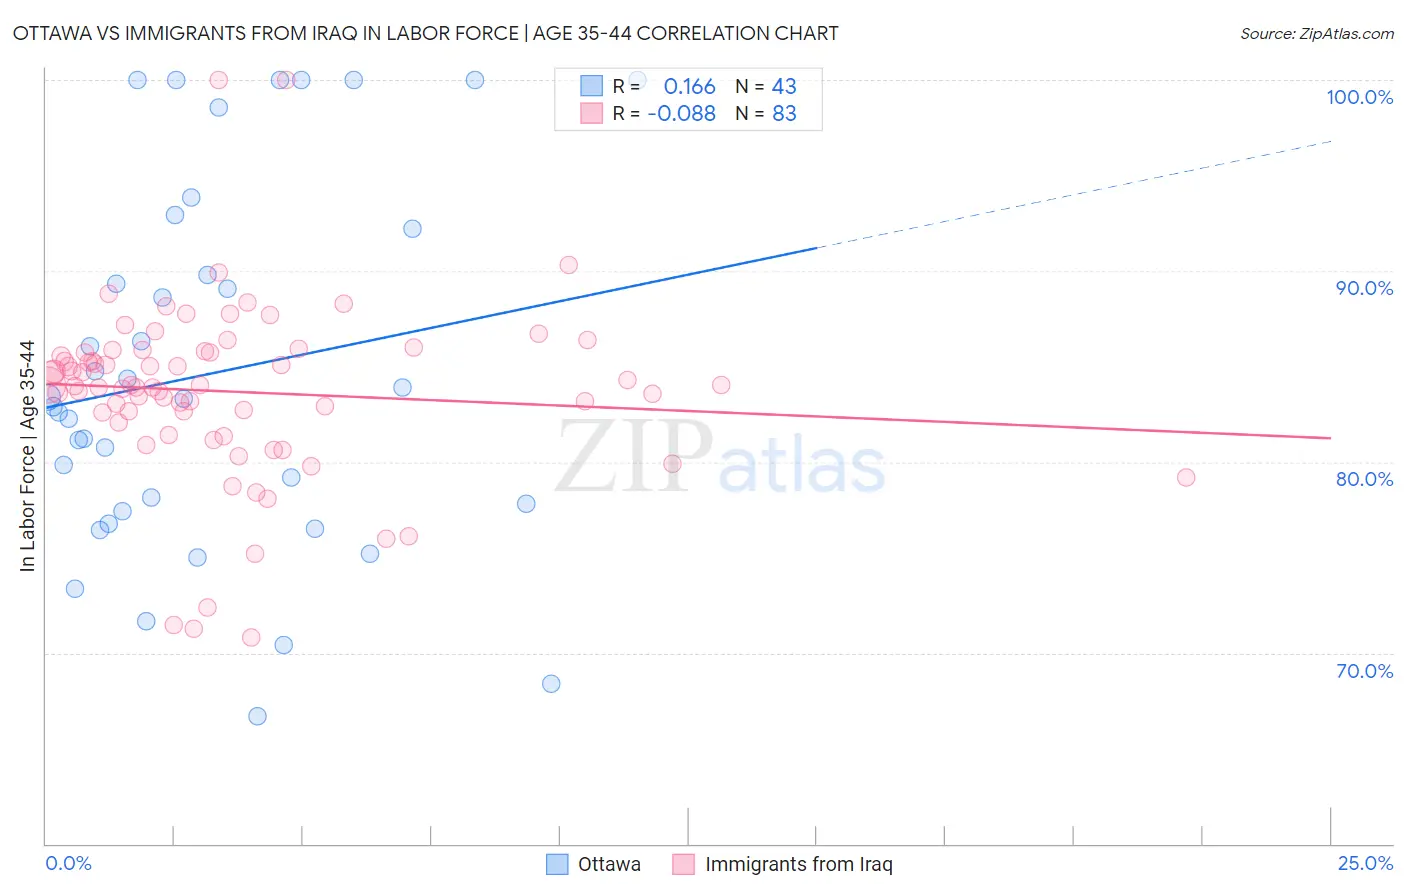
Ottawa vs Immigrants from Iraq In Labor Force | Age 35-44 Correlation Chart
The statistical analysis conducted on geographies consisting of 49,950,273 people shows a poor positive correlation between the proportion of Ottawa and labor force participation rate among population between the ages 35 and 44 in the United States with a correlation coefficient (R) of 0.166 and weighted average of 82.6%. Similarly, the statistical analysis conducted on geographies consisting of 194,714,153 people shows a slight negative correlation between the proportion of Immigrants from Iraq and labor force participation rate among population between the ages 35 and 44 in the United States with a correlation coefficient (R) of -0.088 and weighted average of 83.9%, a difference of 1.7%.
In Labor Force | Age 35-44 Correlation Summary
| Measurement | Ottawa | Immigrants from Iraq |
| Minimum | 66.7% | 70.8% |
| Maximum | 100.0% | 100.0% |
| Range | 33.3% | 29.2% |
| Mean | 84.6% | 83.7% |
| Median | 83.3% | 84.0% |
| Interquartile 25% (IQ1) | 77.4% | 82.0% |
| Interquartile 75% (IQ3) | 92.2% | 85.8% |
| Interquartile Range (IQR) | 14.8% | 3.8% |
| Standard Deviation (Sample) | 9.6% | 4.7% |
| Standard Deviation (Population) | 9.5% | 4.7% |
Similar Demographics by In Labor Force | Age 35-44
Demographics Similar to Ottawa by In Labor Force | Age 35-44
In terms of in labor force | age 35-44, the demographic groups most similar to Ottawa are Tlingit-Haida (82.5%, a difference of 0.010%), Mexican American Indian (82.6%, a difference of 0.020%), Hmong (82.6%, a difference of 0.020%), Central American Indian (82.5%, a difference of 0.080%), and Spanish American Indian (82.5%, a difference of 0.10%).
| Demographics | Rating | Rank | In Labor Force | Age 35-44 |
| Pennsylvania Germans | 0.0 /100 | #291 | Tragic 82.9% |
| Immigrants | Latin America | 0.0 /100 | #292 | Tragic 82.8% |
| Spanish Americans | 0.0 /100 | #293 | Tragic 82.8% |
| Potawatomi | 0.0 /100 | #294 | Tragic 82.7% |
| Immigrants | Lebanon | 0.0 /100 | #295 | Tragic 82.7% |
| Mexican American Indians | 0.0 /100 | #296 | Tragic 82.6% |
| Hmong | 0.0 /100 | #297 | Tragic 82.6% |
| Ottawa | 0.0 /100 | #298 | Tragic 82.6% |
| Tlingit-Haida | 0.0 /100 | #299 | Tragic 82.5% |
| Central American Indians | 0.0 /100 | #300 | Tragic 82.5% |
| Spanish American Indians | 0.0 /100 | #301 | Tragic 82.5% |
| Americans | 0.0 /100 | #302 | Tragic 82.4% |
| Nepalese | 0.0 /100 | #303 | Tragic 82.4% |
| Marshallese | 0.0 /100 | #304 | Tragic 82.4% |
| Shoshone | 0.0 /100 | #305 | Tragic 82.2% |
Demographics Similar to Immigrants from Iraq by In Labor Force | Age 35-44
In terms of in labor force | age 35-44, the demographic groups most similar to Immigrants from Iraq are Scottish (83.9%, a difference of 0.030%), Immigrants from Thailand (84.0%, a difference of 0.040%), Native Hawaiian (83.9%, a difference of 0.040%), Immigrants from Germany (83.9%, a difference of 0.040%), and British West Indian (84.0%, a difference of 0.060%).
| Demographics | Rating | Rank | In Labor Force | Age 35-44 |
| Immigrants | Panama | 6.4 /100 | #223 | Tragic 84.0% |
| U.S. Virgin Islanders | 6.1 /100 | #224 | Tragic 84.0% |
| Immigrants | Burma/Myanmar | 6.1 /100 | #225 | Tragic 84.0% |
| Panamanians | 5.4 /100 | #226 | Tragic 84.0% |
| British West Indians | 5.3 /100 | #227 | Tragic 84.0% |
| Welsh | 5.3 /100 | #228 | Tragic 84.0% |
| Immigrants | Thailand | 4.7 /100 | #229 | Tragic 84.0% |
| Immigrants | Iraq | 3.7 /100 | #230 | Tragic 83.9% |
| Scottish | 3.2 /100 | #231 | Tragic 83.9% |
| Native Hawaiians | 3.0 /100 | #232 | Tragic 83.9% |
| Immigrants | Germany | 2.8 /100 | #233 | Tragic 83.9% |
| Immigrants | Oceania | 2.6 /100 | #234 | Tragic 83.9% |
| Immigrants | Syria | 2.5 /100 | #235 | Tragic 83.9% |
| West Indians | 2.4 /100 | #236 | Tragic 83.9% |
| English | 1.8 /100 | #237 | Tragic 83.8% |