Ottawa vs Immigrants from Bangladesh In Labor Force | Age 35-44
COMPARE
Ottawa
Immigrants from Bangladesh
In Labor Force | Age 35-44
In Labor Force | Age 35-44 Comparison
Ottawa
Immigrants from Bangladesh
82.6%
IN LABOR FORCE | AGE 35-44
0.0/ 100
METRIC RATING
298th/ 347
METRIC RANK
82.9%
IN LABOR FORCE | AGE 35-44
0.0/ 100
METRIC RATING
286th/ 347
METRIC RANK
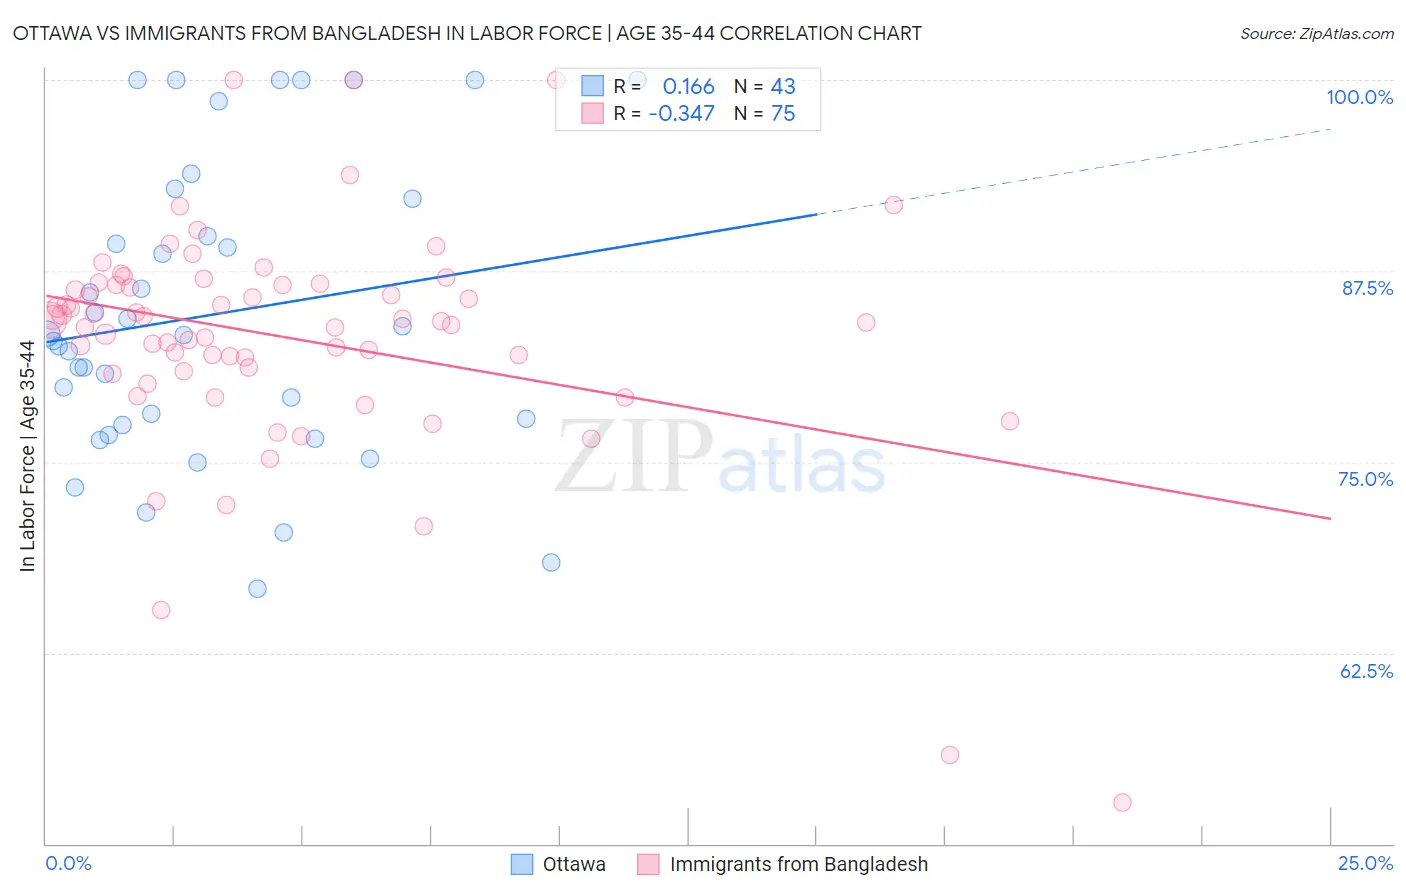
Ottawa vs Immigrants from Bangladesh In Labor Force | Age 35-44 Correlation Chart
The statistical analysis conducted on geographies consisting of 49,950,273 people shows a poor positive correlation between the proportion of Ottawa and labor force participation rate among population between the ages 35 and 44 in the United States with a correlation coefficient (R) of 0.166 and weighted average of 82.6%. Similarly, the statistical analysis conducted on geographies consisting of 203,615,335 people shows a mild negative correlation between the proportion of Immigrants from Bangladesh and labor force participation rate among population between the ages 35 and 44 in the United States with a correlation coefficient (R) of -0.347 and weighted average of 82.9%, a difference of 0.46%.
In Labor Force | Age 35-44 Correlation Summary
| Measurement | Ottawa | Immigrants from Bangladesh |
| Minimum | 66.7% | 52.7% |
| Maximum | 100.0% | 100.0% |
| Range | 33.3% | 47.3% |
| Mean | 84.6% | 83.1% |
| Median | 83.3% | 84.2% |
| Interquartile 25% (IQ1) | 77.4% | 81.0% |
| Interquartile 75% (IQ3) | 92.2% | 86.6% |
| Interquartile Range (IQR) | 14.8% | 5.6% |
| Standard Deviation (Sample) | 9.6% | 7.6% |
| Standard Deviation (Population) | 9.5% | 7.5% |
Demographics Similar to Ottawa and Immigrants from Bangladesh by In Labor Force | Age 35-44
In terms of in labor force | age 35-44, the demographic groups most similar to Ottawa are Tlingit-Haida (82.5%, a difference of 0.010%), Mexican American Indian (82.6%, a difference of 0.020%), Hmong (82.6%, a difference of 0.020%), Central American Indian (82.5%, a difference of 0.080%), and Spanish American Indian (82.5%, a difference of 0.10%). Similarly, the demographic groups most similar to Immigrants from Bangladesh are Fijian (82.9%, a difference of 0.0%), Immigrants from Belize (82.9%, a difference of 0.0%), Immigrants from Dominican Republic (82.9%, a difference of 0.010%), Osage (82.9%, a difference of 0.020%), and Immigrants from Guatemala (82.9%, a difference of 0.020%).
| Demographics | Rating | Rank | In Labor Force | Age 35-44 |
| Osage | 0.0 /100 | #282 | Tragic 82.9% |
| Immigrants | Guatemala | 0.0 /100 | #283 | Tragic 82.9% |
| Immigrants | Dominican Republic | 0.0 /100 | #284 | Tragic 82.9% |
| Fijians | 0.0 /100 | #285 | Tragic 82.9% |
| Immigrants | Bangladesh | 0.0 /100 | #286 | Tragic 82.9% |
| Immigrants | Belize | 0.0 /100 | #287 | Tragic 82.9% |
| Puget Sound Salish | 0.0 /100 | #288 | Tragic 82.9% |
| Chippewa | 0.0 /100 | #289 | Tragic 82.9% |
| Africans | 0.0 /100 | #290 | Tragic 82.9% |
| Pennsylvania Germans | 0.0 /100 | #291 | Tragic 82.9% |
| Immigrants | Latin America | 0.0 /100 | #292 | Tragic 82.8% |
| Spanish Americans | 0.0 /100 | #293 | Tragic 82.8% |
| Potawatomi | 0.0 /100 | #294 | Tragic 82.7% |
| Immigrants | Lebanon | 0.0 /100 | #295 | Tragic 82.7% |
| Mexican American Indians | 0.0 /100 | #296 | Tragic 82.6% |
| Hmong | 0.0 /100 | #297 | Tragic 82.6% |
| Ottawa | 0.0 /100 | #298 | Tragic 82.6% |
| Tlingit-Haida | 0.0 /100 | #299 | Tragic 82.5% |
| Central American Indians | 0.0 /100 | #300 | Tragic 82.5% |
| Spanish American Indians | 0.0 /100 | #301 | Tragic 82.5% |
| Americans | 0.0 /100 | #302 | Tragic 82.4% |