Ottawa vs Australian In Labor Force | Age 35-44
COMPARE
Ottawa
Australian
In Labor Force | Age 35-44
In Labor Force | Age 35-44 Comparison
Ottawa
Australians
82.6%
IN LABOR FORCE | AGE 35-44
0.0/ 100
METRIC RATING
298th/ 347
METRIC RANK
84.3%
IN LABOR FORCE | AGE 35-44
35.1/ 100
METRIC RATING
186th/ 347
METRIC RANK
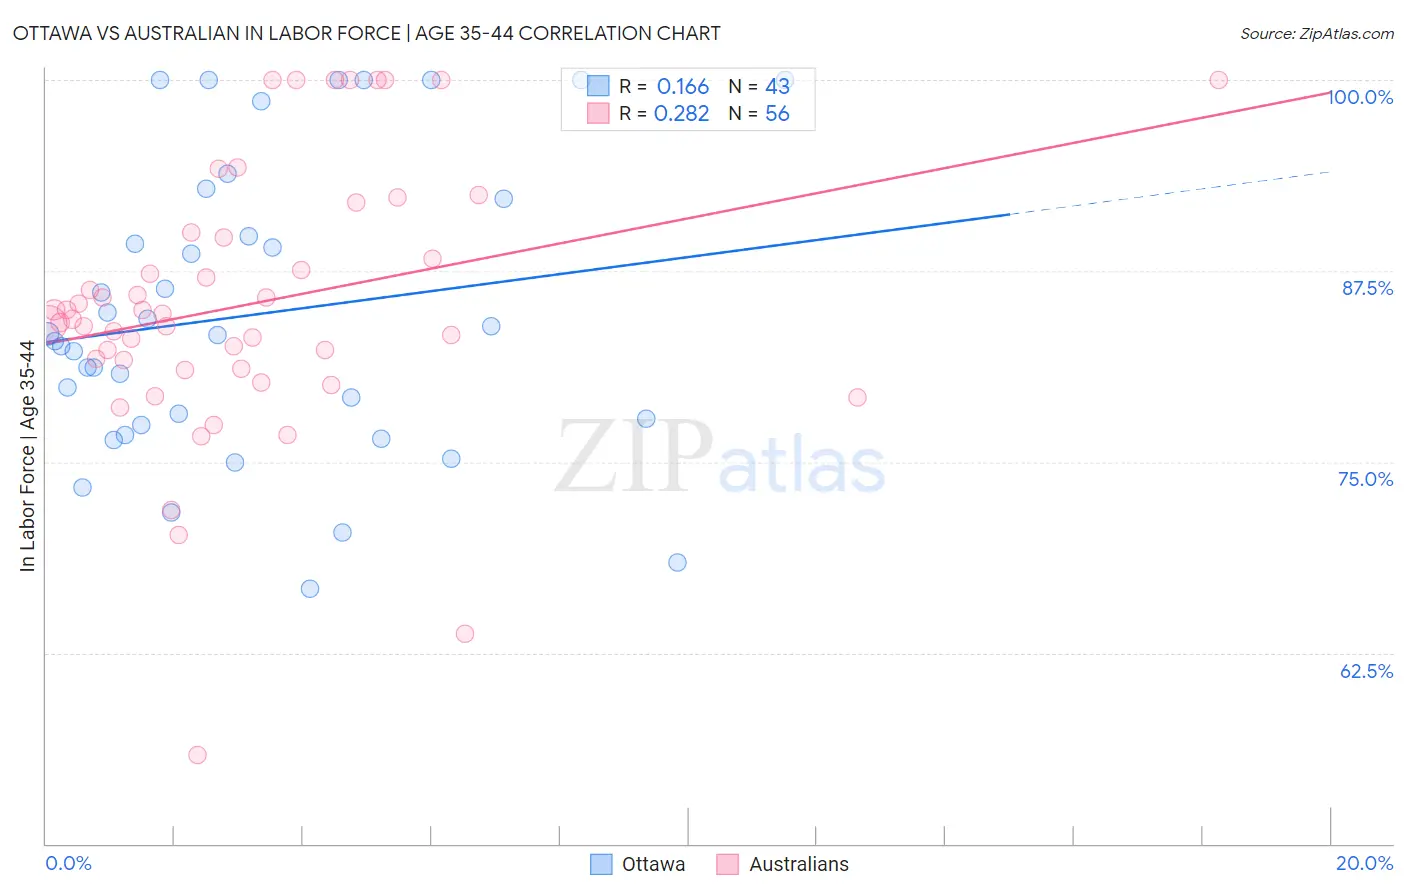
Ottawa vs Australian In Labor Force | Age 35-44 Correlation Chart
The statistical analysis conducted on geographies consisting of 49,950,273 people shows a poor positive correlation between the proportion of Ottawa and labor force participation rate among population between the ages 35 and 44 in the United States with a correlation coefficient (R) of 0.166 and weighted average of 82.6%. Similarly, the statistical analysis conducted on geographies consisting of 224,086,573 people shows a weak positive correlation between the proportion of Australians and labor force participation rate among population between the ages 35 and 44 in the United States with a correlation coefficient (R) of 0.282 and weighted average of 84.3%, a difference of 2.1%.
In Labor Force | Age 35-44 Correlation Summary
| Measurement | Ottawa | Australian |
| Minimum | 66.7% | 55.8% |
| Maximum | 100.0% | 100.0% |
| Range | 33.3% | 44.2% |
| Mean | 84.6% | 85.4% |
| Median | 83.3% | 84.5% |
| Interquartile 25% (IQ1) | 77.4% | 81.4% |
| Interquartile 75% (IQ3) | 92.2% | 89.8% |
| Interquartile Range (IQR) | 14.8% | 8.5% |
| Standard Deviation (Sample) | 9.6% | 8.9% |
| Standard Deviation (Population) | 9.5% | 8.8% |
Similar Demographics by In Labor Force | Age 35-44
Demographics Similar to Ottawa by In Labor Force | Age 35-44
In terms of in labor force | age 35-44, the demographic groups most similar to Ottawa are Tlingit-Haida (82.5%, a difference of 0.010%), Mexican American Indian (82.6%, a difference of 0.020%), Hmong (82.6%, a difference of 0.020%), Central American Indian (82.5%, a difference of 0.080%), and Spanish American Indian (82.5%, a difference of 0.10%).
| Demographics | Rating | Rank | In Labor Force | Age 35-44 |
| Pennsylvania Germans | 0.0 /100 | #291 | Tragic 82.9% |
| Immigrants | Latin America | 0.0 /100 | #292 | Tragic 82.8% |
| Spanish Americans | 0.0 /100 | #293 | Tragic 82.8% |
| Potawatomi | 0.0 /100 | #294 | Tragic 82.7% |
| Immigrants | Lebanon | 0.0 /100 | #295 | Tragic 82.7% |
| Mexican American Indians | 0.0 /100 | #296 | Tragic 82.6% |
| Hmong | 0.0 /100 | #297 | Tragic 82.6% |
| Ottawa | 0.0 /100 | #298 | Tragic 82.6% |
| Tlingit-Haida | 0.0 /100 | #299 | Tragic 82.5% |
| Central American Indians | 0.0 /100 | #300 | Tragic 82.5% |
| Spanish American Indians | 0.0 /100 | #301 | Tragic 82.5% |
| Americans | 0.0 /100 | #302 | Tragic 82.4% |
| Nepalese | 0.0 /100 | #303 | Tragic 82.4% |
| Marshallese | 0.0 /100 | #304 | Tragic 82.4% |
| Shoshone | 0.0 /100 | #305 | Tragic 82.2% |
Demographics Similar to Australians by In Labor Force | Age 35-44
In terms of in labor force | age 35-44, the demographic groups most similar to Australians are Armenian (84.3%, a difference of 0.0%), Costa Rican (84.3%, a difference of 0.0%), Dutch (84.3%, a difference of 0.0%), Immigrants from West Indies (84.3%, a difference of 0.010%), and Korean (84.3%, a difference of 0.010%).
| Demographics | Rating | Rank | In Labor Force | Age 35-44 |
| Immigrants | South Africa | 42.8 /100 | #179 | Average 84.3% |
| Danes | 38.8 /100 | #180 | Fair 84.3% |
| Immigrants | West Indies | 36.4 /100 | #181 | Fair 84.3% |
| Koreans | 36.3 /100 | #182 | Fair 84.3% |
| Barbadians | 36.2 /100 | #183 | Fair 84.3% |
| Armenians | 35.6 /100 | #184 | Fair 84.3% |
| Costa Ricans | 35.3 /100 | #185 | Fair 84.3% |
| Australians | 35.1 /100 | #186 | Fair 84.3% |
| Dutch | 34.8 /100 | #187 | Fair 84.3% |
| South Africans | 34.1 /100 | #188 | Fair 84.3% |
| Immigrants | Denmark | 33.7 /100 | #189 | Fair 84.3% |
| Portuguese | 31.9 /100 | #190 | Fair 84.3% |
| Immigrants | Philippines | 27.9 /100 | #191 | Fair 84.2% |
| Immigrants | Vietnam | 27.4 /100 | #192 | Fair 84.2% |
| Hungarians | 26.8 /100 | #193 | Fair 84.2% |