Immigrants from Caribbean vs Australian In Labor Force | Age 35-44
COMPARE
Immigrants from Caribbean
Australian
In Labor Force | Age 35-44
In Labor Force | Age 35-44 Comparison
Immigrants from Caribbean
Australians
84.2%
IN LABOR FORCE | AGE 35-44
25.7/ 100
METRIC RATING
195th/ 347
METRIC RANK
84.3%
IN LABOR FORCE | AGE 35-44
35.1/ 100
METRIC RATING
186th/ 347
METRIC RANK
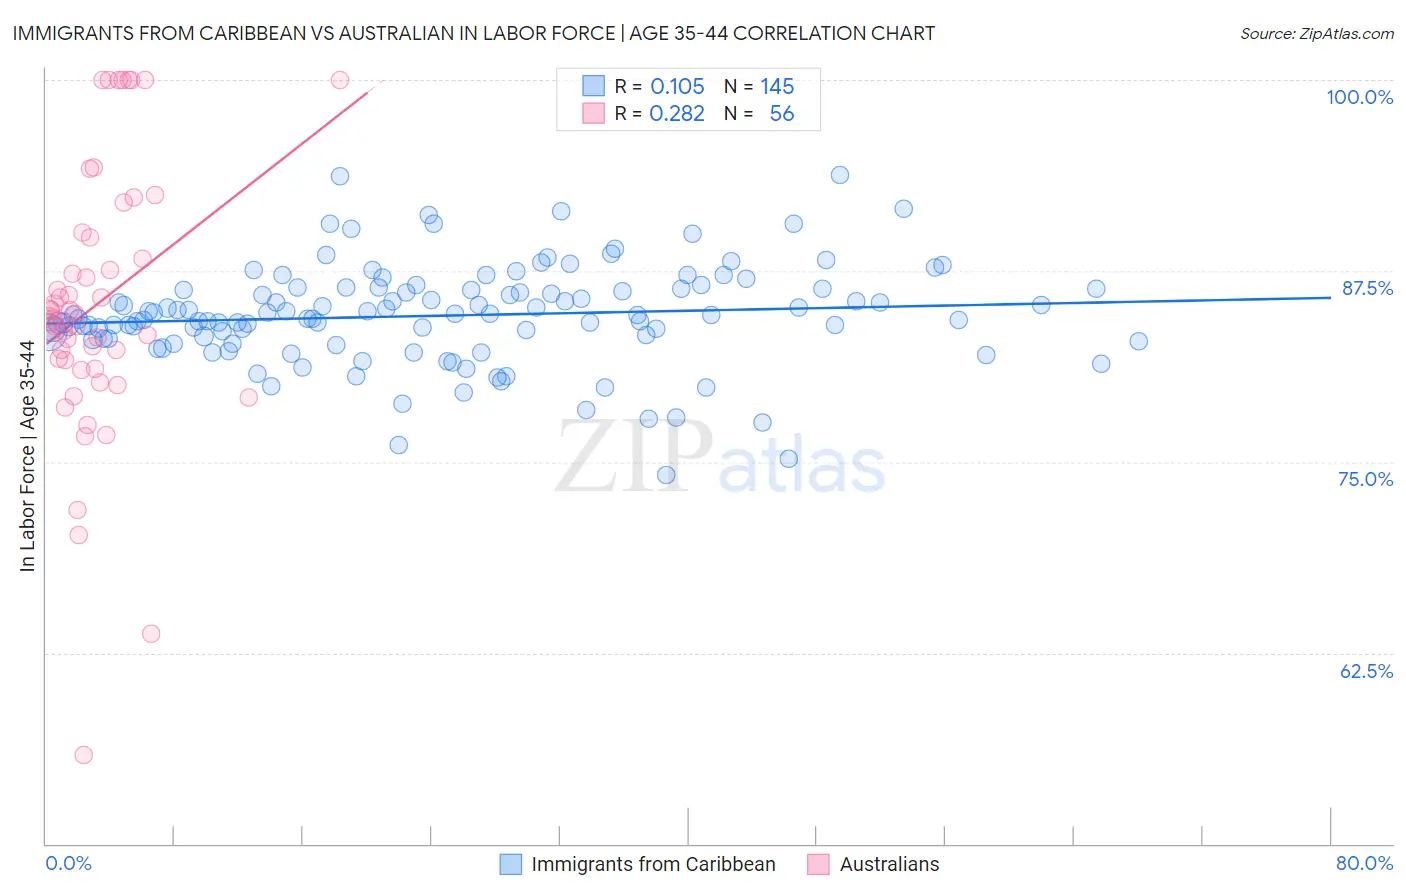
Immigrants from Caribbean vs Australian In Labor Force | Age 35-44 Correlation Chart
The statistical analysis conducted on geographies consisting of 449,756,256 people shows a poor positive correlation between the proportion of Immigrants from Caribbean and labor force participation rate among population between the ages 35 and 44 in the United States with a correlation coefficient (R) of 0.105 and weighted average of 84.2%. Similarly, the statistical analysis conducted on geographies consisting of 224,086,573 people shows a weak positive correlation between the proportion of Australians and labor force participation rate among population between the ages 35 and 44 in the United States with a correlation coefficient (R) of 0.282 and weighted average of 84.3%, a difference of 0.070%.
In Labor Force | Age 35-44 Correlation Summary
| Measurement | Immigrants from Caribbean | Australian |
| Minimum | 74.1% | 55.8% |
| Maximum | 93.8% | 100.0% |
| Range | 19.7% | 44.2% |
| Mean | 84.6% | 85.4% |
| Median | 84.6% | 84.5% |
| Interquartile 25% (IQ1) | 83.0% | 81.4% |
| Interquartile 75% (IQ3) | 86.3% | 89.8% |
| Interquartile Range (IQR) | 3.3% | 8.5% |
| Standard Deviation (Sample) | 3.3% | 8.9% |
| Standard Deviation (Population) | 3.2% | 8.8% |
Demographics Similar to Immigrants from Caribbean and Australians by In Labor Force | Age 35-44
In terms of in labor force | age 35-44, the demographic groups most similar to Immigrants from Caribbean are Immigrants from Indonesia (84.2%, a difference of 0.0%), Immigrants from Vietnam (84.2%, a difference of 0.010%), Hungarian (84.2%, a difference of 0.010%), Immigrants from England (84.2%, a difference of 0.010%), and Immigrants from Western Europe (84.2%, a difference of 0.010%). Similarly, the demographic groups most similar to Australians are Armenian (84.3%, a difference of 0.0%), Costa Rican (84.3%, a difference of 0.0%), Dutch (84.3%, a difference of 0.0%), Immigrants from West Indies (84.3%, a difference of 0.010%), and Korean (84.3%, a difference of 0.010%).
| Demographics | Rating | Rank | In Labor Force | Age 35-44 |
| Danes | 38.8 /100 | #180 | Fair 84.3% |
| Immigrants | West Indies | 36.4 /100 | #181 | Fair 84.3% |
| Koreans | 36.3 /100 | #182 | Fair 84.3% |
| Barbadians | 36.2 /100 | #183 | Fair 84.3% |
| Armenians | 35.6 /100 | #184 | Fair 84.3% |
| Costa Ricans | 35.3 /100 | #185 | Fair 84.3% |
| Australians | 35.1 /100 | #186 | Fair 84.3% |
| Dutch | 34.8 /100 | #187 | Fair 84.3% |
| South Africans | 34.1 /100 | #188 | Fair 84.3% |
| Immigrants | Denmark | 33.7 /100 | #189 | Fair 84.3% |
| Portuguese | 31.9 /100 | #190 | Fair 84.3% |
| Immigrants | Philippines | 27.9 /100 | #191 | Fair 84.2% |
| Immigrants | Vietnam | 27.4 /100 | #192 | Fair 84.2% |
| Hungarians | 26.8 /100 | #193 | Fair 84.2% |
| Immigrants | Indonesia | 25.7 /100 | #194 | Fair 84.2% |
| Immigrants | Caribbean | 25.7 /100 | #195 | Fair 84.2% |
| Immigrants | England | 25.0 /100 | #196 | Fair 84.2% |
| Immigrants | Western Europe | 24.7 /100 | #197 | Fair 84.2% |
| Ecuadorians | 24.0 /100 | #198 | Fair 84.2% |
| Syrians | 23.2 /100 | #199 | Fair 84.2% |
| Moroccans | 23.2 /100 | #200 | Fair 84.2% |