Yugoslavian vs Australian In Labor Force | Age 35-44
COMPARE
Yugoslavian
Australian
In Labor Force | Age 35-44
In Labor Force | Age 35-44 Comparison
Yugoslavians
Australians
84.9%
IN LABOR FORCE | AGE 35-44
97.7/ 100
METRIC RATING
88th/ 347
METRIC RANK
84.3%
IN LABOR FORCE | AGE 35-44
35.1/ 100
METRIC RATING
186th/ 347
METRIC RANK
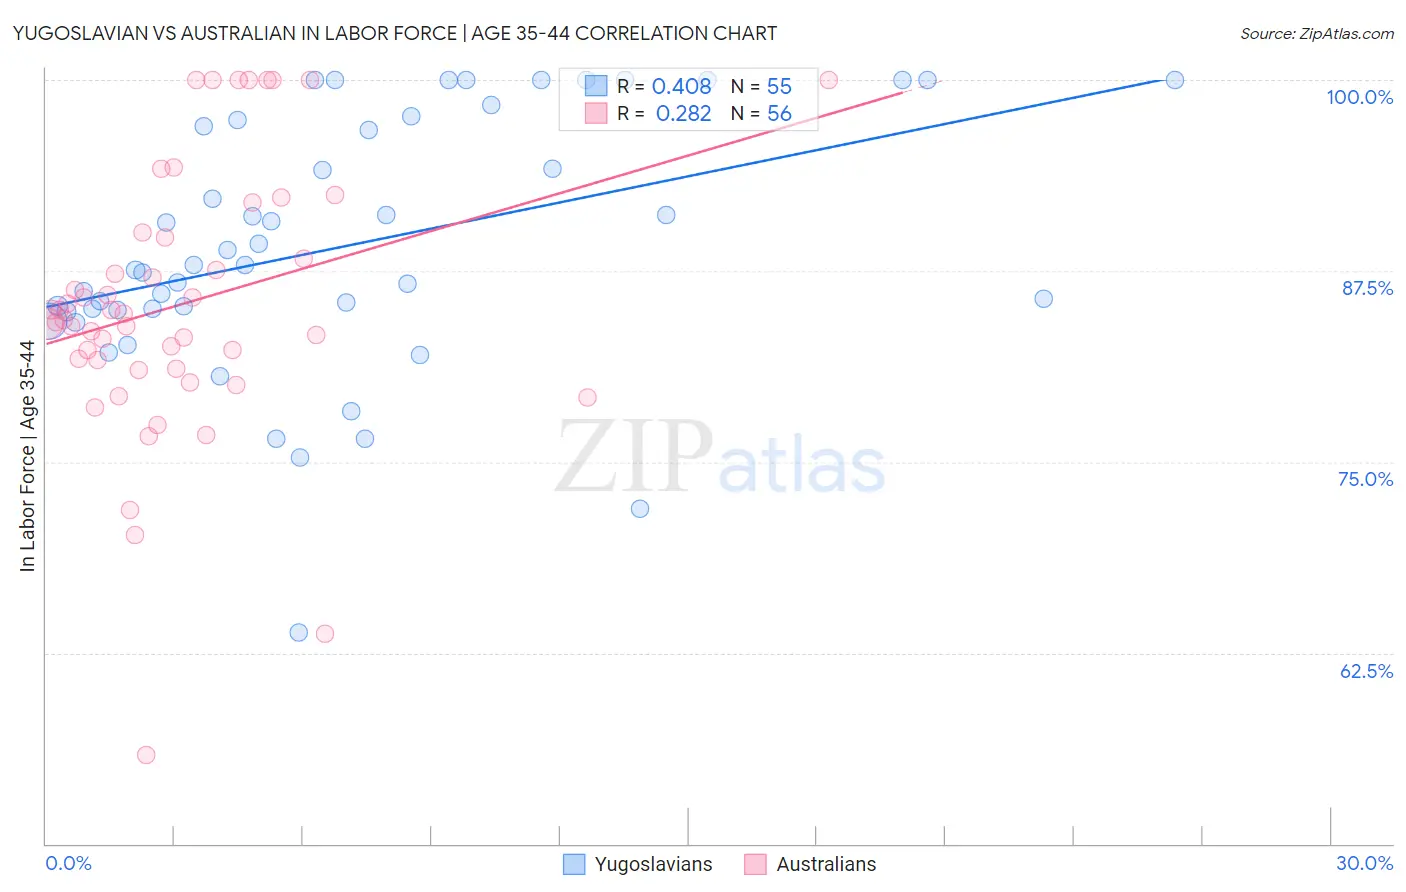
Yugoslavian vs Australian In Labor Force | Age 35-44 Correlation Chart
The statistical analysis conducted on geographies consisting of 285,656,710 people shows a moderate positive correlation between the proportion of Yugoslavians and labor force participation rate among population between the ages 35 and 44 in the United States with a correlation coefficient (R) of 0.408 and weighted average of 84.9%. Similarly, the statistical analysis conducted on geographies consisting of 224,086,573 people shows a weak positive correlation between the proportion of Australians and labor force participation rate among population between the ages 35 and 44 in the United States with a correlation coefficient (R) of 0.282 and weighted average of 84.3%, a difference of 0.71%.
In Labor Force | Age 35-44 Correlation Summary
| Measurement | Yugoslavian | Australian |
| Minimum | 63.8% | 55.8% |
| Maximum | 100.0% | 100.0% |
| Range | 36.2% | 44.2% |
| Mean | 89.1% | 85.4% |
| Median | 87.9% | 84.5% |
| Interquartile 25% (IQ1) | 85.0% | 81.4% |
| Interquartile 75% (IQ3) | 97.4% | 89.8% |
| Interquartile Range (IQR) | 12.4% | 8.5% |
| Standard Deviation (Sample) | 8.3% | 8.9% |
| Standard Deviation (Population) | 8.2% | 8.8% |
Similar Demographics by In Labor Force | Age 35-44
Demographics Similar to Yugoslavians by In Labor Force | Age 35-44
In terms of in labor force | age 35-44, the demographic groups most similar to Yugoslavians are Greek (84.9%, a difference of 0.0%), Belgian (84.9%, a difference of 0.0%), Senegalese (84.9%, a difference of 0.010%), Immigrants from Peru (84.9%, a difference of 0.010%), and Immigrants from Middle Africa (84.9%, a difference of 0.010%).
| Demographics | Rating | Rank | In Labor Force | Age 35-44 |
| Immigrants | Eastern Europe | 98.3 /100 | #81 | Exceptional 84.9% |
| Immigrants | Sudan | 98.1 /100 | #82 | Exceptional 84.9% |
| Senegalese | 97.8 /100 | #83 | Exceptional 84.9% |
| Immigrants | Peru | 97.8 /100 | #84 | Exceptional 84.9% |
| Immigrants | Middle Africa | 97.8 /100 | #85 | Exceptional 84.9% |
| Greeks | 97.8 /100 | #86 | Exceptional 84.9% |
| Belgians | 97.7 /100 | #87 | Exceptional 84.9% |
| Yugoslavians | 97.7 /100 | #88 | Exceptional 84.9% |
| Immigrants | Pakistan | 97.5 /100 | #89 | Exceptional 84.9% |
| Immigrants | France | 97.4 /100 | #90 | Exceptional 84.9% |
| Immigrants | Europe | 97.2 /100 | #91 | Exceptional 84.9% |
| Ghanaians | 97.2 /100 | #92 | Exceptional 84.8% |
| Immigrants | Northern Africa | 97.1 /100 | #93 | Exceptional 84.8% |
| Mongolians | 96.8 /100 | #94 | Exceptional 84.8% |
| Immigrants | Kuwait | 96.7 /100 | #95 | Exceptional 84.8% |
Demographics Similar to Australians by In Labor Force | Age 35-44
In terms of in labor force | age 35-44, the demographic groups most similar to Australians are Armenian (84.3%, a difference of 0.0%), Costa Rican (84.3%, a difference of 0.0%), Dutch (84.3%, a difference of 0.0%), Immigrants from West Indies (84.3%, a difference of 0.010%), and Korean (84.3%, a difference of 0.010%).
| Demographics | Rating | Rank | In Labor Force | Age 35-44 |
| Immigrants | South Africa | 42.8 /100 | #179 | Average 84.3% |
| Danes | 38.8 /100 | #180 | Fair 84.3% |
| Immigrants | West Indies | 36.4 /100 | #181 | Fair 84.3% |
| Koreans | 36.3 /100 | #182 | Fair 84.3% |
| Barbadians | 36.2 /100 | #183 | Fair 84.3% |
| Armenians | 35.6 /100 | #184 | Fair 84.3% |
| Costa Ricans | 35.3 /100 | #185 | Fair 84.3% |
| Australians | 35.1 /100 | #186 | Fair 84.3% |
| Dutch | 34.8 /100 | #187 | Fair 84.3% |
| South Africans | 34.1 /100 | #188 | Fair 84.3% |
| Immigrants | Denmark | 33.7 /100 | #189 | Fair 84.3% |
| Portuguese | 31.9 /100 | #190 | Fair 84.3% |
| Immigrants | Philippines | 27.9 /100 | #191 | Fair 84.2% |
| Immigrants | Vietnam | 27.4 /100 | #192 | Fair 84.2% |
| Hungarians | 26.8 /100 | #193 | Fair 84.2% |