Colville vs Australian In Labor Force | Age 35-44
COMPARE
Colville
Australian
In Labor Force | Age 35-44
In Labor Force | Age 35-44 Comparison
Colville
Australians
81.7%
IN LABOR FORCE | AGE 35-44
0.0/ 100
METRIC RATING
311th/ 347
METRIC RANK
84.3%
IN LABOR FORCE | AGE 35-44
35.1/ 100
METRIC RATING
186th/ 347
METRIC RANK
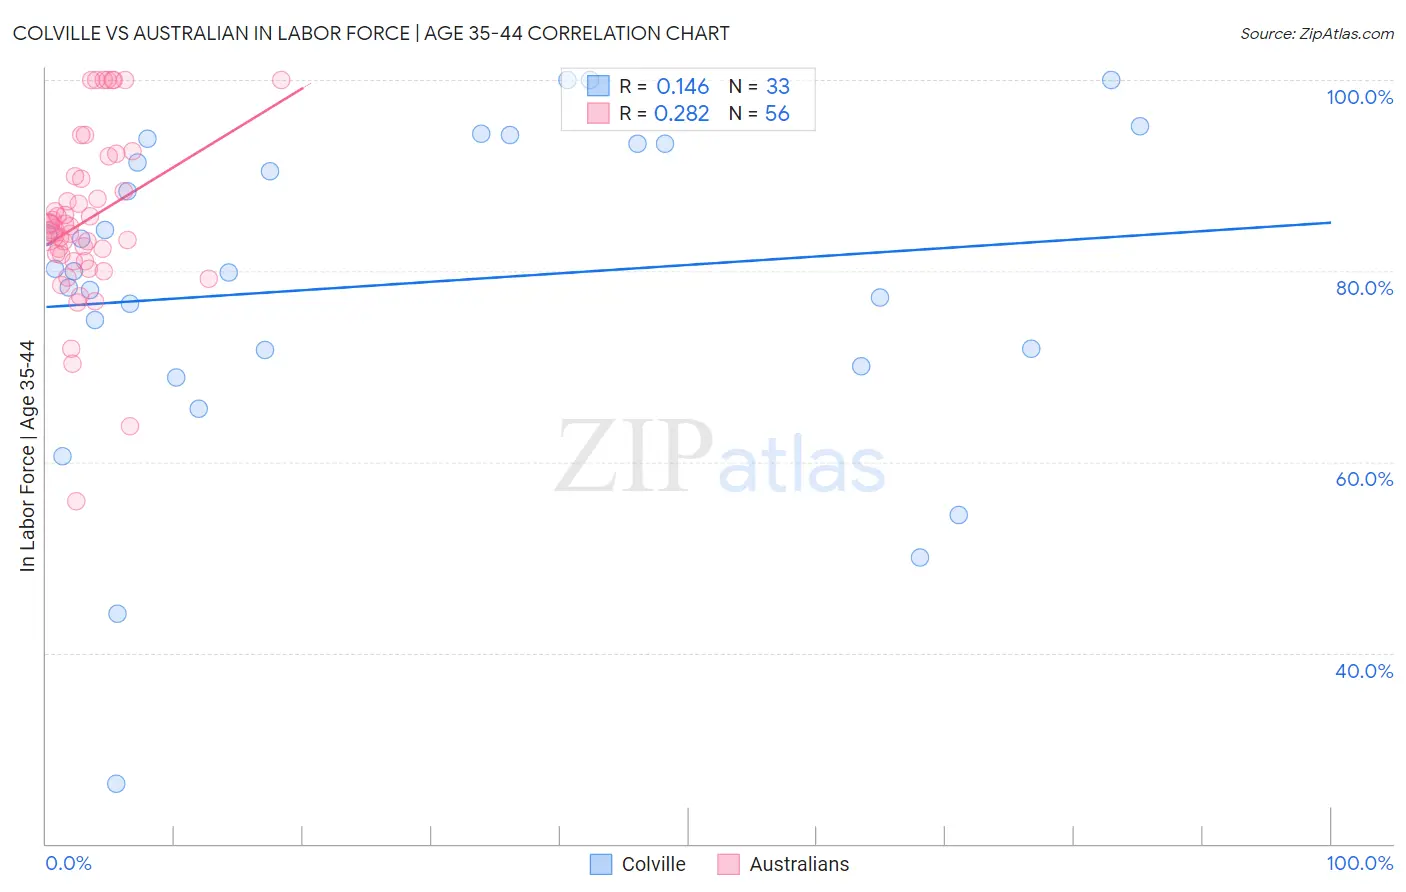
Colville vs Australian In Labor Force | Age 35-44 Correlation Chart
The statistical analysis conducted on geographies consisting of 34,682,533 people shows a poor positive correlation between the proportion of Colville and labor force participation rate among population between the ages 35 and 44 in the United States with a correlation coefficient (R) of 0.146 and weighted average of 81.7%. Similarly, the statistical analysis conducted on geographies consisting of 224,086,573 people shows a weak positive correlation between the proportion of Australians and labor force participation rate among population between the ages 35 and 44 in the United States with a correlation coefficient (R) of 0.282 and weighted average of 84.3%, a difference of 3.1%.
In Labor Force | Age 35-44 Correlation Summary
| Measurement | Colville | Australian |
| Minimum | 26.3% | 55.8% |
| Maximum | 100.0% | 100.0% |
| Range | 73.7% | 44.2% |
| Mean | 78.6% | 85.4% |
| Median | 79.9% | 84.5% |
| Interquartile 25% (IQ1) | 70.8% | 81.4% |
| Interquartile 75% (IQ3) | 93.3% | 89.8% |
| Interquartile Range (IQR) | 22.5% | 8.5% |
| Standard Deviation (Sample) | 17.1% | 8.9% |
| Standard Deviation (Population) | 16.9% | 8.8% |
Similar Demographics by In Labor Force | Age 35-44
Demographics Similar to Colville by In Labor Force | Age 35-44
In terms of in labor force | age 35-44, the demographic groups most similar to Colville are Alaska Native (81.6%, a difference of 0.14%), Mexican (81.6%, a difference of 0.15%), Blackfeet (81.9%, a difference of 0.17%), Cajun (81.5%, a difference of 0.26%), and Immigrants from Mexico (81.5%, a difference of 0.28%).
| Demographics | Rating | Rank | In Labor Force | Age 35-44 |
| Marshallese | 0.0 /100 | #304 | Tragic 82.4% |
| Shoshone | 0.0 /100 | #305 | Tragic 82.2% |
| Blacks/African Americans | 0.0 /100 | #306 | Tragic 82.2% |
| Hispanics or Latinos | 0.0 /100 | #307 | Tragic 82.1% |
| Immigrants | Central America | 0.0 /100 | #308 | Tragic 82.0% |
| Cree | 0.0 /100 | #309 | Tragic 82.0% |
| Blackfeet | 0.0 /100 | #310 | Tragic 81.9% |
| Colville | 0.0 /100 | #311 | Tragic 81.7% |
| Alaska Natives | 0.0 /100 | #312 | Tragic 81.6% |
| Mexicans | 0.0 /100 | #313 | Tragic 81.6% |
| Cajuns | 0.0 /100 | #314 | Tragic 81.5% |
| Immigrants | Mexico | 0.0 /100 | #315 | Tragic 81.5% |
| Comanche | 0.0 /100 | #316 | Tragic 81.5% |
| Cherokee | 0.0 /100 | #317 | Tragic 81.4% |
| Alaskan Athabascans | 0.0 /100 | #318 | Tragic 81.3% |
Demographics Similar to Australians by In Labor Force | Age 35-44
In terms of in labor force | age 35-44, the demographic groups most similar to Australians are Armenian (84.3%, a difference of 0.0%), Costa Rican (84.3%, a difference of 0.0%), Dutch (84.3%, a difference of 0.0%), Immigrants from West Indies (84.3%, a difference of 0.010%), and Korean (84.3%, a difference of 0.010%).
| Demographics | Rating | Rank | In Labor Force | Age 35-44 |
| Immigrants | South Africa | 42.8 /100 | #179 | Average 84.3% |
| Danes | 38.8 /100 | #180 | Fair 84.3% |
| Immigrants | West Indies | 36.4 /100 | #181 | Fair 84.3% |
| Koreans | 36.3 /100 | #182 | Fair 84.3% |
| Barbadians | 36.2 /100 | #183 | Fair 84.3% |
| Armenians | 35.6 /100 | #184 | Fair 84.3% |
| Costa Ricans | 35.3 /100 | #185 | Fair 84.3% |
| Australians | 35.1 /100 | #186 | Fair 84.3% |
| Dutch | 34.8 /100 | #187 | Fair 84.3% |
| South Africans | 34.1 /100 | #188 | Fair 84.3% |
| Immigrants | Denmark | 33.7 /100 | #189 | Fair 84.3% |
| Portuguese | 31.9 /100 | #190 | Fair 84.3% |
| Immigrants | Philippines | 27.9 /100 | #191 | Fair 84.2% |
| Immigrants | Vietnam | 27.4 /100 | #192 | Fair 84.2% |
| Hungarians | 26.8 /100 | #193 | Fair 84.2% |